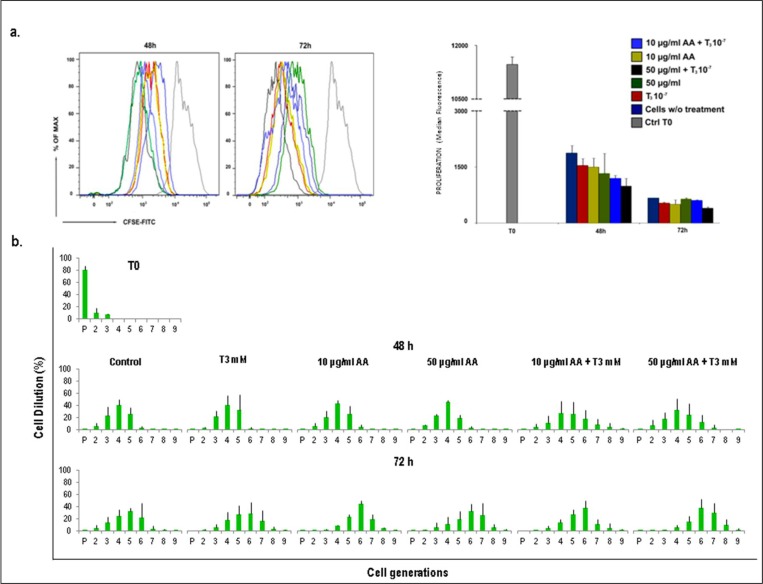
Figure 2.
Cell tracking assay with CFSE CellTrace™. Tenocytes derived from tendon were stained with CFSE CellTrace™ on day 0. Fluorescence intensity was measured by FACS Calibur flow cytometer in FL1 channel at 48 and 72 h. a) Effect of 10µu/ml AA, 50µu/ml AA, 10−7M T3, 10µu/ml AA + 10−7M T3 and 50µu/ml AA +10−7M T3 on cell proliferation. Fluorescence dilution reflects cell proliferation. A representative histogram shows the highest decrease of CFSE fluorescence adding 50µu/ml AA +10−7M T3 versus control untreated cells. The graph represents the quantification of CFSE median fluorescence index of three independent experiments. b) Histograms show the mean (± SD) of the successive generations of one experiment out of three. Standard deviations are shown.

