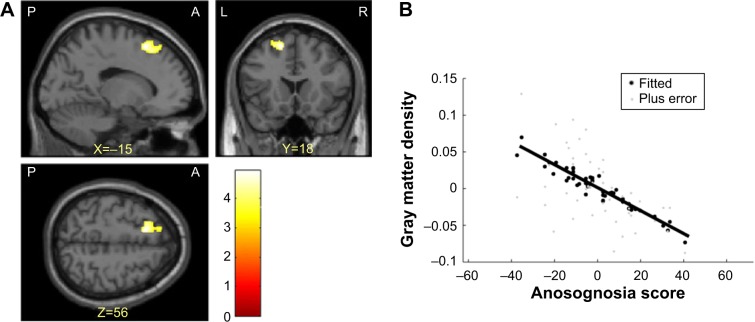
Figure 1.
(A) Regions in which there were significant negative correlations between gray matter density and anosognosia scores using age, years of education, and total intracranial volume as covariates. The left superior frontal gyrus is visualized at the P<0.001 uncorrected level. This region survived the false discovery rate cluster level correction for multiple comparisons at P<0.05. (B) Correlation between gray matter density in the left superior frontal gyrus and anosognosia score at the voxel showing a maximum peak.
Abbreviations: P, posterior; A, anterior; L, left; R, right.

