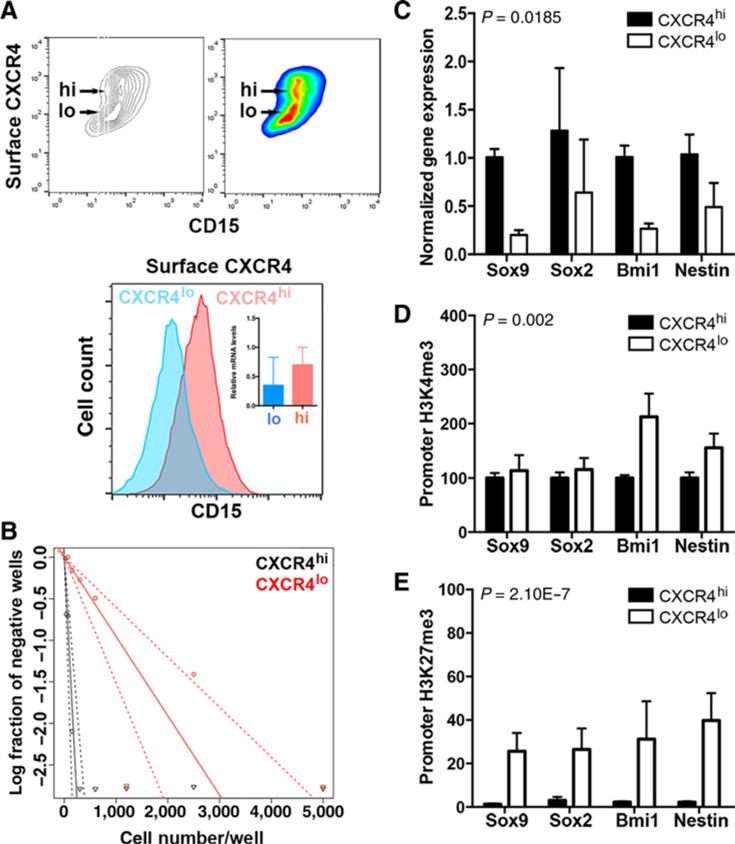
Figure 2.

Levels of surface-localized CXCR4 correlate with a stem-like cell phenotype. A, Secondary flank SmoA1 tumor tissue was dissociated into a single-cell suspension and stained for surface CXCR4 protein and CD15 expression using flow cytometry. Top, noncolored and colored contour maps of results. y-axis, surface CXCR4 signal; x-axis, CD15 signal. The CXCR4hi and CXCR4lo subpopulations are indicated. Bottom, CXCR4hi and CXCR4lo subpopulations were computationally separated and analyzed for their CD15 expression. Inset, qPCR for total CXCR4 expression (n = 3). B–E, Single-cell suspensions of tumor homogenate were physically separated using FACS into CXCR4hi and CXCR4lo subpopulations and analyzed as follows. B, Cells were plated in an in vitro ELDA. A representative ELDA plot is shown; clonogenic cell frequency was calculated using raw data, and the analysis tool is available at http://bioinf.wehi.edu.au/software/elda/. C, Stem cell gene expression was measured by qPCR. D and E, Chromatin was precipitated from FACS-sorted CXCR4hi and CXCR4lo cells with antibody directed against histone H3 trimethylated K4 (D) or histone H3 trimethylated K27 (E), followed by qPCR analysis for the indicated promoter regions. P values (see Materials and Methods) were calculated for comparisons between the two subpopulations.
