
Figure 5.
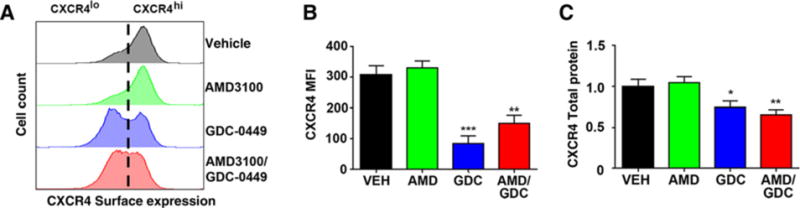
GDC-0449 promotes downregulation of surface CXCR4 in a subset of tumor cells. In vivo–treated tumors were processed into single-cell suspensions and analyzed by flow cytometry or Western blotting. A, Surface expression of CXCR4 was determined using flow cytometry. Representative histograms are shown. To the left of the vertical dotted line is the CXCR4lo and to the right of the dotted line the CXCR4hi subpopulations. B, Total CXCR4 fluorescence intensity (MFI) was quantified from flow cytometry data (n = 3–5 independent tumors from each treatment group). **, P < 0.005; ***, P < 0.001, as compared with vehicle (VEH) using unpaired t test. C, Total CXCR4 was measured using Western blotting. Total protein was normalized to actin and to vehicle-treated tumor samples. *, P < 0.05; **, P < 0.01 as compared with vehicle using unpaired t test; n = 3 to 5 independent tumors from each treatment group.