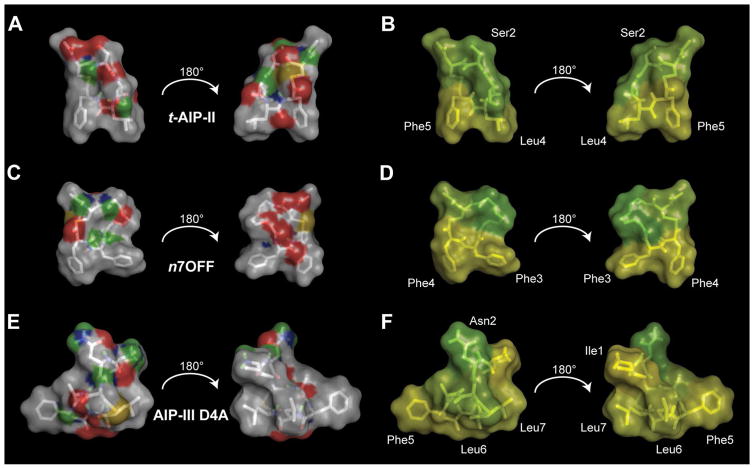
Figure 3.
Surface plots of t-AIP-II, n7OFF, and AIP-III D4A. A), C), and E) Hydrophobic atoms (i.e., carbons and hydrogens) are shown in light gray; the hydrophilic atoms are colored. Green represents hydrogen-bonding hydrogens, gold represents sulfur, blue represents nitrogen, and red represents oxygen. B), D), and F) Residue hydrophobicity is plotted on the surface of molecules by using the Eisenberg hydrophobicity scale. Green indicates less hydrophobicity, and yellow indicates more hydrophobicity. In n7OFF, the n7O linker is set to green, as it is hydrophilic. Selected residues are labeled for clarity. In (A) and (B), hydrophobic groups in t-AIP-II are oriented down, with hydrophilic moieties on either side oriented above, creating an overall amphipathic wedge. In (C) and (D), hydrophobic groups in n7OFF are oriented down, with hydrophilic moieties on either side oriented above, creating an analogous amphipathic wedge to that observed in t-AIP-II. In (E) and (F), the hydrophobic front face of AIP-III D4A is shown, and a subsequent rotation of 180° results in a back view with clustered hydrophobic groups.

