
Figure 1.
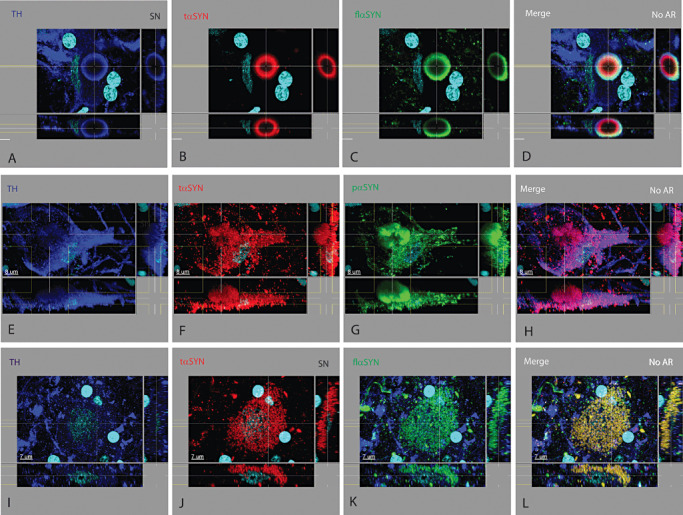
Lesions in the cell body of tyrosine hydroxylase+ neurons in the substantia nigra. At least three types of neuronal lesions were found in the soma of TH+ neurons in PD and ILBD cases. (i) The classic brain stem‐type Lewy body (A–D) was seen to have multiple concentric layers; an inner core that could be filled with variable amounts (often low) of different proteins such as TH and UB (not shown), surrounded by a ring containing TH (A) and tαSYN (B), which was surrounded by a ring containing pαSYN (not shown) and flαSYN (C). Cells containing one or more brain stem‐type Lewy bodies may or may not have observable protein elsewhere in the cytoplasm using these Abs. (ii) A pale body‐like lesion (E–H) was found to contain a variety of proteins including TH (E), tαSYN (F) and pαSYN (G) and other proteins (not shown). In contrast to a cell with a brain stem‐type Lewy body, the cytoplasm often contained these proteins having different aggregated oval to linear shapes in various amounts which coalesced into a more solid type of aggregate not having concentric layers. (iii) In neuronal diffuse cytoplasmic accumulation (I–L), the TH+ soma fills up with a variety of proteins including tαSYN (J), flαSYN (K), pαSYN (not shown) and UB (not shown) while also reducing the level of TH (I). Any combination of these three types of lesions may exist in a TH+ neuron. For this and similar montage figures, the large rectangle in the upper left portion of a panel is looking down on the tissue section and represents the typical plane viewed. The narrow rectangle at the right displays a cross section (orthogonal or perpendicular view) at the plane indicated by the vertical line(s) and the narrow rectangle at the bottom displays a cross section (orthogonal or perpendicular view) at the plane indicated by the horizontal line(s). Features contained within the lines can be visualized in three dimensions for each labeled protein (indicated in upper left in color of channel). Nuclei may or may not be shown in a field were labeled with DAPI and colored light blue. The secondary Abs used for fluorescence emit light at a specific wavelength and were pseudo‐colored (Supporting Information Table S1). Scale bar shown in all confocal figures. For three color/channel montages, the first three vertical panels represent a different primary Ab and the last panel is a merged image. Each row represents a different tissue section, location, lesion and set of Abs. The type of AR used indicated in merged image. Images are best viewed digitally to allow zooming and panning.