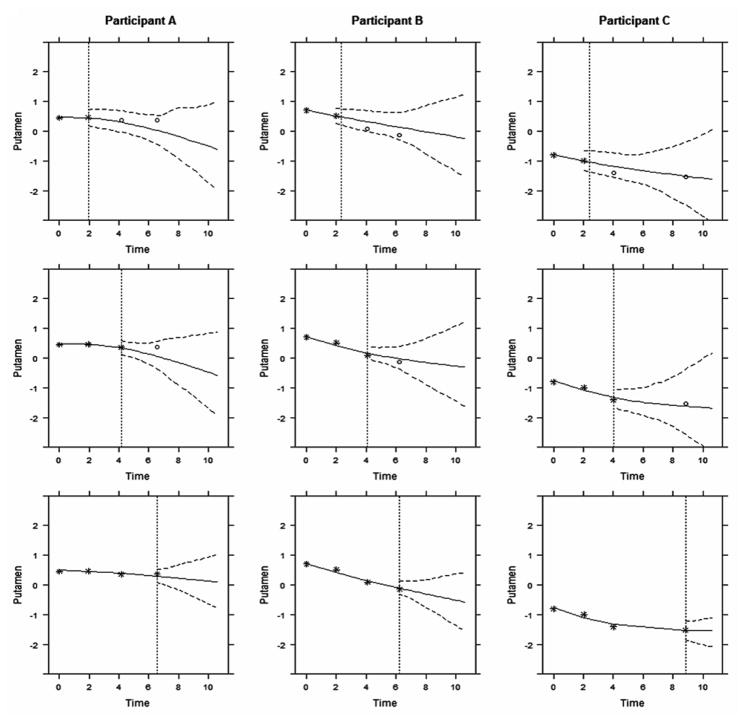
Figure 3. The predicted longitudinal trajectories of putamen ICV measurement with a 95% pointwise uncertainty band.
The vertical dotted lines represent the time point of the last putamen measurement. Each column represent one participants. From top to bottom, predictions were calculated accounting for all putamen ICV that measured previously and were updated when new measure became available. Stars denote observed measures, and circles denote future observations.

