FIG. 2.
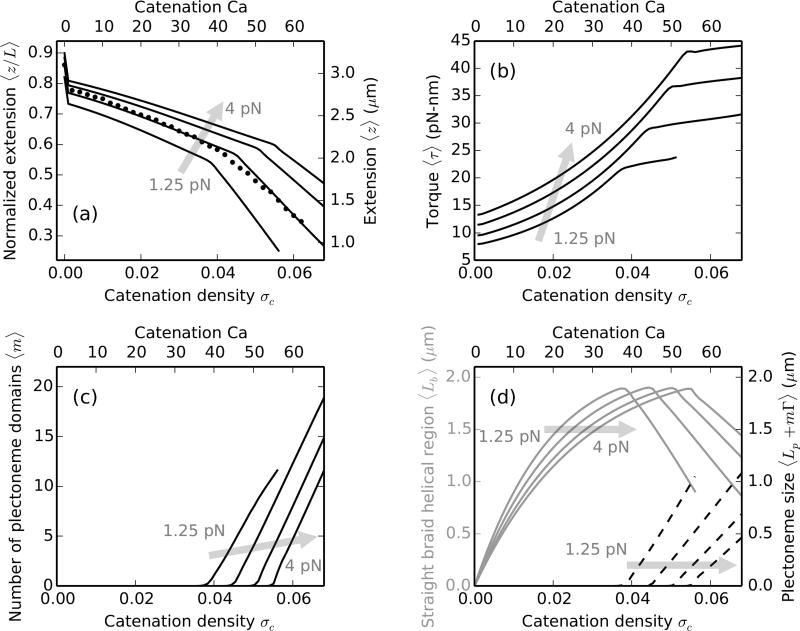
DNA braids at 100 mM monovalent salt under various forces, the shaded arrows show the direction of increasing force. Theoretical predictions are for ≈11 kb (L = 3.6 µm) long double helices, tethered 1.5 µm (d = 0.42L) apart. Catenation (Ca) and catenation density (σc = Ca/Lk0) are plotted on the top and the bottom x-axes respectively. (a) Relative end-to-end distance (left y-axis) or extension (right y-axis) versus catenation. Lines are theoretical predictions for 1.25 (lowest curve), 2, 3 and 4 pN (highest curve) force, while filled circles are experimental data at 2 pN [11]. The change in slope of the lines corresponds to plectonemic buckling transition, which is at a higher catenation for larger external tension due to increased stability of the force-coupled straight state. The kink at the onset of buckling transition is related to the plectoneme-nucleation cost presented by the braid end loop. (b) Torque in the braid shows a non-linear increase in the straight phase, and continues to increase in the coexistence phase but with a much weaker slope. The torsional stress is released in the coexistence phase due to the contribution from plectoneme writhe (Eq. 17). (c) Number of plectonemic domains versus catenation, showing that the buckled phase is characterized by multiple plectoneme domains. Nucleation of new domains causes the increase of torque in the coexistence phase, as opposed to a constant torque expected in the case of a single plectoneme domain. (d) Plot of the size of the straight-phase helical region 〈Lb〉 (left y-axis, solid gray curves) and the size of the plectoneme region 〈Lp + mΓ〉 (right y-axis, dashed black curves) as a function of catenation. Lb increases in the straight phase with catenation till the buckling point, after which Lb decreases as DNA length is passed into the plectoneme phase, also seen in the increase in the total size of the plectoneme.

