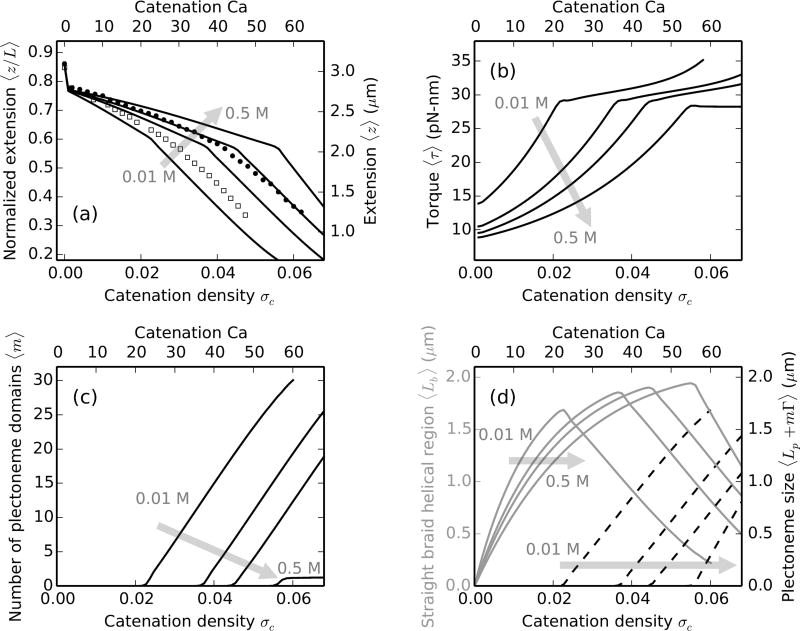
FIG. 3.
Effect of salt concentration on ≈11 kb (L = 3.6 µm) DNA braids under 2 pN force. The tether points are 1.5 µm (d = 0.42L) apart. Theoretical curves are plotted for (0.01, 0.05, 0.1 and 0.5) M salt concentrations, where the shaded arrows show the direction of increasing salt concentration. Catenation (Ca) and catenation density (σc ≡ Ca/Lk0) are plotted on the top and the bottom x-axes respectively. (a) Relative end-to-end extension (left y-axis) or extension (right y-axis) versus catenation shows smaller extension and buckling at a lower catenation for lower salt concentrations. Low salt increases the effective DNA diameter, which effectively increases the twist elasticity of the braid, thereby decreasing the stability of the straight phase. The filled circles (0.1 M) and open squares (0.01 M) are experimental data reproduced from Ref. [11]. (b) Torque in the braid shows a non-linear increase in all salt conditions. Also, twist stiffening occurs faster for braids at lower salt concentration due to the larger radius of the braid. The critical buckling torque, being a thermodynamic variable does not vary significantly with the salt concentration. (c) The number of plectoneme domains versus catenation or catenation density, showing nucleation of multiple domains of plectoneme at lower salt concentrations, while a single plectoneme state is favored at higher salts. Smaller excluded diameter of the braid at higher salt makes the superhelical bending in the plectoneme phase favorable over nucleation of new domains. (d) The size of the straight phase helical wrappings 〈Lb〉 (left y-axis, solid gray curves) and the size of the plectonemic phase 〈Lp + mΓ〉 (right y-axis, dashed black lines) versus catenation. Lb increases faster for lower salt concentrations due to larger braid radii (Table I).

