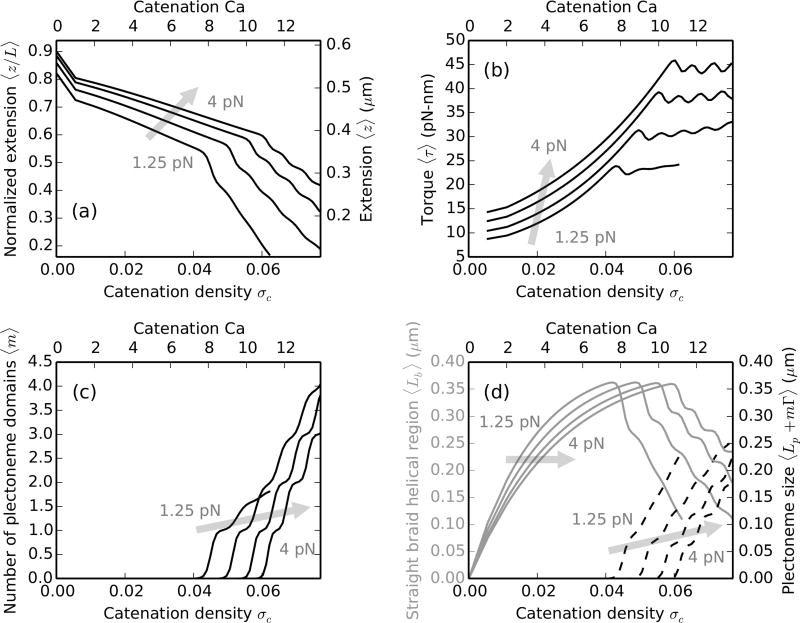
FIG. 5.
Braiding ≈2 kb (L = 0.65 µm) DNA at 100 mM Na+ with forces f = 1.25, 2, 3 and 4 pN, where the shaded arrows show the direction of increasing force. The intertether distance is 0.26 µm (d = 0.4L), where the top and the bottom x-axes show catenation and catenation density (σc ≡ Ca/Lk0) in the braid. (a) Relative extension (left y-axis) or extension (right y-axis) versus catenation for short DNA molecules. (b) Torque vs catenation shows multiple discrete “overshoots”, corresponding to the nucleation of new plectoneme domains. (c) Number of plectoneme domains vs catenation. The appearance of new plectoneme domains coincides with the steps in the extension or overshoots in the torque. (d) The size of the straight-phase helical region 〈Lb〉 (left y-axis, solid gray curves) and the size of the plectoneme phase 〈Lp + mΓ〉 (right y-axis, dashed black curves) versus catenation, where steps are associated with the formation of finite-length braid end loops. The successive nucleation events are smoothed out by thermal fluctuations in braids made up of long DNA molecules (≳ 4 kb).

