FIG. 7.
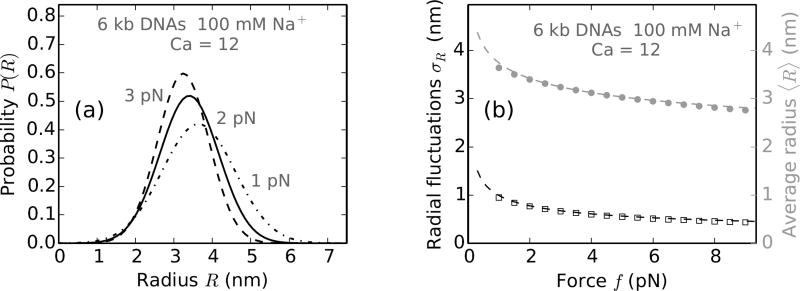
Radial fluctuations in braid with L = 2 µm, d = 800nm and Ca= 12. (a) Probability distribution of braid radii (Eq. B.4), plotted for applied forces of 1 pN (dot-dashed line), 2 pN (solid line) and 3 pN (dashed line). Note the broadening of the distribution at lower forces indicating higher fluctuations. R = 1 nm corresponds to the excluded volume radius of the DNA molecules, included while calculating the average radius via free energy minimization but not explicitly taken into account in plotting Eq. B.4. (b) Variation of the standard deviation of the radial distribution σR (black open squares) and the average value of the radius 〈R〉 (shaded filled circles) with the external tension (f) on the braid. The dashed lines correspond to best-fit equations: σR = σ0(βAf)−0.35 and 〈R〉 = R0(βAf)−0.13, where σ0 = 2.4 nm and R0 = 5.2 nm. The exact power laws depend on the catenation in the braid, however, both the average value and the fluctuations in braid radius always decrease with increasing force.

