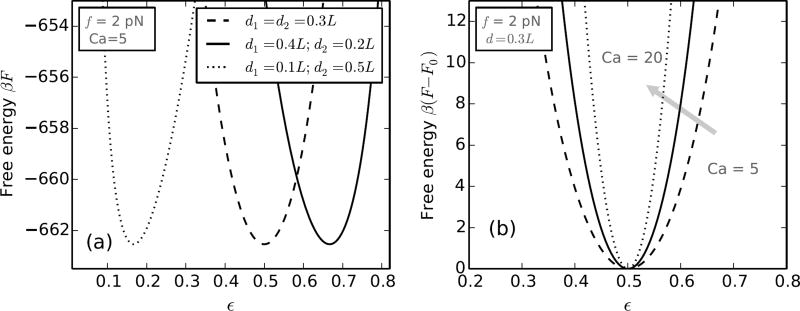
FIG. 9.
Effect of the intertether distance. (a) Comparison of the free energy versus ε (Eq. D.1) for braids with various choices of the two intertether distances d1 and d2, but keeping the arithmetic mean of the two distances the same. The end-region where the two DNAs are closer to each other is smaller in size (i.e., has less DNA in it), and vice-versa. (b) Free energy versus ε for braids at various catenations (Ca=5, 12 and 20) with identical intertether distances d = 0.3L. The stiffness of the free energy decreases for lower catenation values indicating higher fluctuations in the relative sizes of the two end regions. The free energy curves have been shifted in the y-axis in order to overlay them.

