Abstract
Alterations in energetic state of the myocardium are associated with decompensated heart failure in humans and in animal models. However, the functional consequences of the observed changes in energetic state on mechanical function are not known. The primary aim of the study was to quantify mechanical/energetic coupling in the heart and to determine if energetic dysfunction can contribute to mechanical failure. A secondary aim was to apply a quantitative systems pharmacology analysis to investigate the effects of drugs that target cross-bridge cycling kinetics in heart failure-associated energetic dysfunction. Herein, a model of metabolite- and calcium-dependent myocardial mechanics was developed from calcium concentration and tension time courses in rat cardiac muscle obtained at different lengths and stimulation frequencies. The muscle dynamics model accounting for the effect of metabolites was integrated into a model of the cardiac ventricles to simulate pressure-volume dynamics in the heart. This cardiac model was integrated into a simple model of the circulation to investigate the effects of metabolic state on whole-body function. Simulations predict that reductions in metabolite pools observed in canine models of heart failure can cause systolic dysfunction, blood volume expansion, venous congestion, and ventricular dilation. Simulations also predict that myosin-activating drugs may partially counteract the effects of energetic state on cross-bridge mechanics in heart failure while increasing myocardial oxygen consumption. Our model analysis demonstrates how metabolic changes observed in heart failure are alone sufficient to cause systolic dysfunction and whole-body heart failure symptoms.
Keywords: Congestive heart failure, Metabolism, Myofilaments, Frank-Starling law, Omecamtiv mecarbil
Introduction
Normal cardiac function depends on oxidative ATP synthesis, within the myocardium, even under resting conditions, consuming oxygen at a rate of approximately 3.5 mL/min/kg in humans [1]. ATP-dependent processes such as cross-bridge cycling require that ATP be synthesized at high enough concentrations, and with ADP and inorganic phosphate (Pi) at low enough concentrations, that normal functions are not kinetically or thermodynamically impaired. When cardiac work increases with increasing heart rate and contractility, ADP and Pi concentrations increase due to higher rates of ATP utilization [2, 3]. In diseased states the relationships between cardiac work rate and concentrations of these metabolites can be altered. For example, the phosphocreatine/ATP ratio has been shown to be diminished compared to normal in patients with aortic valve disease [4] and dilated cardiomyopathy [5, 6]. Furthermore, the concentration of ATP in myocardium is lower in heart failure patients than in healthy subjects [5–8]. Although heart-failure is a complex syndrome which can arise due to a variety of pathophysiological abnormalities [9], alterations to the energetics state (e.g., ATP hydrolysis potential, phosphocreatine/creatine ratio) of the myocardium are hallmark of heart failure regardless of the underlying etiology [7, 8, 10].
Although these observations reveal clear relationships between energy metabolite concentrations and disease state in the myocardium, no mechanistic functional connection has been established [11–13]. To what extent do the observed changes in metabolic concentrations affect molecular processes that are coupled to ATP hydrolysis in the myocardium? To what extent are systolic and diastolic function affected by concentrations of these metabolites? To what extent may energetic dysfunction represent a cause of mechanical dysfunction in heart failure?
These questions are addressed here by developing a model to simulate how the observed changes in metabolic concentrations affect tension development in the myocardium, cardiac pumping, and whole-body cardiovascular function. Specifically, we have developed a multi-scale model of cardiovascular dynamics that integrates myocardial energetics and cross-bridge kinetics with whole-organ and whole-body models of the heart and the circulation. The model is based on previously developed and independently validated models of myocardial energy metabolism [2, 3, 14], cardiac muscle dynamics [15], and whole-organ heart mechanics and pumping [16]. Integrating these components together using a recently developed model of the cardiac cross-bridge kinetics/dynamics that accounts for the influence of [MgATP], [MgADP] and [Pi] on state transitions [15], we are able to computationally predict how metabolic state influences cardiac function and whole-body cardiovascular state. These simulations allow us to computationally isolate the metabolic component of heart failure, representing other components (such as calcium handling processes, cardiac geometry, passive mechanical properties) as normal. Thus, they provide a means to probe the extent to which energetic dysfunction influences mechanical function in heart failure.
To build this integrated model, data on calcium concentration and tension time courses in rat cardiac muscle are used to extend the model presented in [15] to account for calcium-dependent activation of myofilaments. This updated cross-bridge model, is combined with a model of oxidative ATP synthesis to capture the effect of altered energetic state, as seen in decompensated hypertrophy [3], on whole-organ (and whole-body) function. Cardiac mechanics is simulated using a computationally inexpensive model [16] and circulatory system is simulated using a lumped parameter model. Parameters associated with the lumped compartments (e.g., systemic/pulmonary arteries etc.) are identified from experimental observations made exclusively in rat. The resulting whole-body model (illustrated in Figure 1) provides an unprecedented ability to simulate the effects of altered cardiac energetic state, as observed in decompensated hypertrophy, on mechanics of the heart and its consequence on whole-body cardiovascular phenotype.
Figure 1.
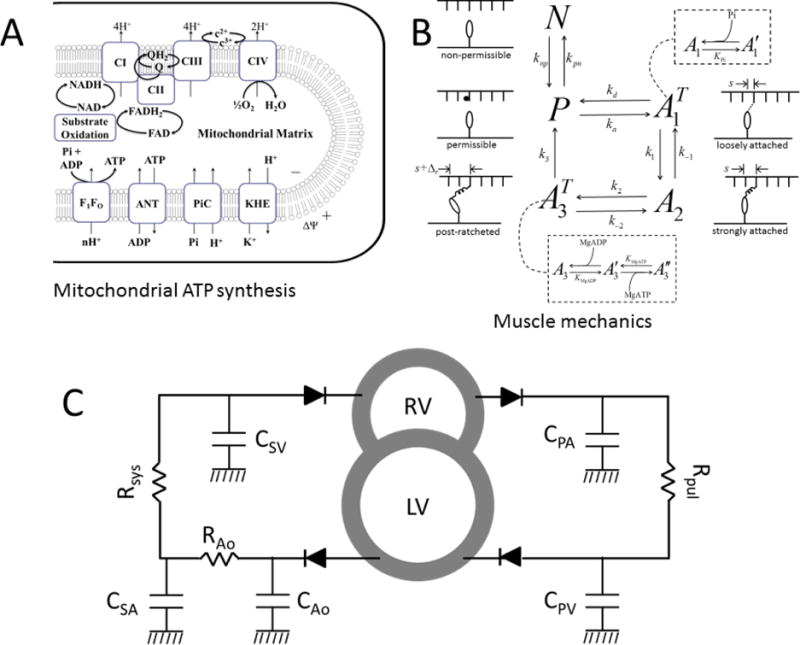
Schematics showing mechanoenergetics coupling and whole-body cardiovascular system. A. Model of oxidative phosphorylation used to compute metabolite concentration from basal ATP hydrolysis rate under normal and failing-heart conditions. B. Schematics of the cross-bridge kinetic model. The state N is a non-permissible XB state where myosin heads cannot bind with actin (as in the absence of cytosolic Ca2+), while P is a permissible XB state during which myosin heads can bind with actin molecules. The transition from state N to P depends on thick-thin filament overlap and Ca2+ concentration. The states and A2 represent loosely and strongly bound cross-bridge attached state; is the strongly bound (post-ratcheted or post-powerstroke) state. C. Schematics of the CVS model used to simulate Frank-Starling curves. Diodes represent inlet/outlet valves and ensure one-way blood flow. CPA, CPV, CSA, CAo and CSV represent lumped compliances of pulmonary artery, pulmonary vein, systemic artery and systemic vein. Rpul, Rsys and RAo represent vascular resistances. RV and LV represent right and left ventricular cavities.
Our model simulations predict that the alterations to energetic state, even in the absence of other remodeling that occurs in heart failure, lead to mechanical dysfunction, venous congestion, and ventricular dilation. These predictions suggest that metabolic alterations may play a central role as a driving force for mechanical failure in decompensated hypertrophy and heart failure. Furthermore, simulations of the effects of a myosin-activating drug, such as omecamtive mecarbil, are shown to ameliorate the predicted effects of metabolic dysfunction at the cost of increased myocardial oxygen consumption, in agreement with recent reports [17, 18].
Methods
This section describes the components of the multi-scale model used here and the experimental data used to identify the components. The first three subsections describe the experimental data used to: (1.) estimate parameters for the myofilament activation component of the model, (2.) estimate parameters associated with heart geometry, and (3.) estimate parameters associated with (lumped) systemic/pulmonic compartments. The remaining subsections briefly describe the model components. A complete description of all model details is presented in the Appendix.
Experimental data for identifying myofilament activation
The activation framework of the myofilament model is identified by fitting to time-to-peak tension (TTP), relaxation time to 50% tension (RT50) and maximum developed tension (Tdev) data obtained from rat cardiac muscle at different muscle lengths and frequencies [19]. The identified myofilament model is validated by simulating an independent experiment studying the effects of muscle length on rate of tension redevelopment (Ktr) in intact rat cardiac muscle at body temperature [20]. Additional simulations studying the effect of MgATP, MgADP, Pi, Ca2+ and temperature on rate of tension development, and force-calcium-length relationship are shown in appendix E–H. All of the RT50, TTP, Tdev and Ca2+ transient data used for model identification are from Janssen et al. [19]. In brief, RT50, TTP, and Tdev data were determined as functions of: (1.) imposed sarcomere lengths (SL) of 1.9, 2.0, 2.1 and 2.2 μm at fixed stimulation frequency of 4Hz; and (2.) varying stimulation frequency between 2–10Hz at fixed SL of 2.2 μm.
Calcium transient data obtained during same experimental conditions at different stimulation frequencies were used to drive the myofilament model and generate associated tension time courses. The model was simulated for 25 cycles, at each frequency, to reach steady-state. Steady-state data were fit to experimental data to minimize error between model simulated data and experimental data.
Experiments to determine RV, LV and septum wall mass
Hearts were excised by thoracotomy and dissection from three female Sprague Dawley rats with an average bodyweight of ~350g while they were in a surgical plane of anesthesia. The surgical plane of anesthesia was achieved by intra-peritoneal injection of 90 mg/Kg Ketamine and 0.5 mg/Kg dexmedetomidine. All procedures were performed according to protocols approved by the University Committee on Use and Care of Animals at the University of Michigan, and conforms NIH guidelines. The right ventricular (RV) free wall of each excised heart was dissected and blotted wet weights were determined for the RV free wall and the LV and interventricular septum for each heart. The average weight of RV free wall was 0.19g and LV (plus septum) wall mass was 0.72g. These weights were converted into volumes and used to determine LV and RV cavity volumes (values listed in Table D.1).
Experimental data used to estimate circulatory parameters
Compliances associated with lumped compartments of systemic (CSA, CSV) and pulmonary circulation (CPA, CPV) were constrained using experimental data from literature on pulse pressure and mean pressure [21–24]. Systemic vasculature and pulmonary vasculature resistances were calculated using: R = (Pup – Pdown)/F. Here, R represents (Rsys or Rpul), Pup and Pdown represent pressure in compartment upstream and downstream to the resistance (R) and F represent flow between upstream and downstream compartment. For Rsys, Pup = 100 mmHg [23] and Pdown = 2 mmHg [25] and for Rpul, Pup = 20 mmHg [23] and Pdown = 4 mmHg [22]. Flow (F) is assumed to be 50 mL/min for Rsys and Rpul [22]. Aortic compliance (CAo) and resistance downstream to aorta (RAo) are set to match the shape of LV pressure-volume to the pressure-volume loop measured in vivo in rats [25].
Cardiac muscle model
The model used to represent the cross-bridge kinetics and force generation is based on the model of Tewari et al. [15] which is extended here to account for the calcium activation and force generation at body temperature. The kinetics of myofilament activation are based on the model of Rice et al. [26] which assumes that filament overlap between thick and thin filament increases binding affinity of Ca2+ for Troponin C (TrpC) and hence increases the transition rate between non-permissible (N) to permissible cross bridges (P) (see Figure 1B). Sarcomere geometry and the associated thick-thin filament overlap function is adapted from Rice et al. [26] with small difference in the assumed lengths of the thick filament [27] and a tension dependent unbinding of Ca2+ from TrpC [28]. The myofilament model invokes a total of 7 adjustable parameters which were identified by simultaneously fitting data on TTP, RT50 and Tdev, at different sarcomere lengths and stimulation frequencies, from rat cardiac muscle obtained at body temperature. Passive force generation by the cardiac muscle is based on the formulation of Rice et al. [26] as it is specific to rat and accounts for contribution from titin and collagen. Maximum passive force is assumed to be 7 kPa and is in agreement with literature [16]. See appendix A–C for details on myofilament activation and passive force formulation.
Heart mechanics
The TriSeg model of Lumens et al. [16] is used to simulate LV and RV interaction via inter-ventricular septum wall. One major modification was made to the Lumens model by replacing their empirical myofiber model with a biophysically detailed model of a rat cardiac muscle cell (discussed above). The new cardiac muscle cell model accounts for: (1.) explicit binding of calcium/metabolite to the myosin and actin filaments, (2.) effect of strain on myosin-actin interaction, and (3.) effect of temperature on force generation.
Briefly, theTriSeg model represents heart as three thick-walled spherical segments forming LV and RV cavities. In this model, changes in cardiac afterload alter wall segment geometry and hence alter the strain sensed by cardiac muscle which in turn affects the stress generated by an individual wall segment. Wall stress and geometries are used to calculate representative radial and axial tensile forces acting on the junction margin. Lastly, septum wall geometry is adjusted such that equilibrium of tensile forces is maintained at the junction margin.
Force generation in the three wall segments is simulated using three cardiac muscle models. Appendix D shows how the force generated from the myofilament model is used to compute ventricular pressure. Even though the underlying muscle model is the same for all three segments, they function differently because of differences in wall thickness, cavity volume, strain of each wall segment and ventricular interaction. The TriSeg model invokes three adjustable parameters (called reference midwall area) used to compute strain sensed by individual wall segments. These parameters are estimated based on fits to data tabulated in Table 1.
Table 1.
Comparison of model outputs with experimental data
| Parameter | Model | Data |
|---|---|---|
| Cardiac output (mL min−1) | 50 | 42 – 62 [25] |
| Ejection Fraction (%) | 58 | 42 – 87 [25] |
| End-diastolic Volume (μL) | 203 | 170 – 266 [25] |
| Stroke Volume (μL) | 119 | 101 – 154 [25] |
| Systemic Pulse pressure (mmHg) | 33 | 34±7 [31], 36 [30] |
| Pulmonary Pulse pressure (mmHg) | 12 | 13 [30], 10 [21] |
| Mean systemic arterial pressure (mmHg) | 98 | 95±5 [31], 109±1 [30] |
| Mean pulmonary arterial pressure (mmHg) | 20 | 20±1 [30] |
Lumped cardiovascular system (CVS) model
The heart model (discussed above) is coupled with a simple circulatory model illustrated in Figure 1C to simulate whole-body cardiovascular dynamics. Body weight of the animal is used to compute total blood volume based on the Lee and Blaufox equation [29].The circulatory system model has a five lumped compartments: aorta, systemic artery, systemic vein, pulmonary artery and pulmonary vein. Flow between two adjoining compartments does not account for inertia and is calculated:
Where, P1 and P2 represent pressure in compartment ‘1’ and ‘2’, and R represents the pressure drop between the compartments. The rate of change in volume and pressure of a compartment is given by:
Here, qin and qout are the flow in and out of the compartment, and C is the compliance of the compartment. The parameters associated with the circulation model are identified by matching data on cardiac output, ejection fraction, stroke volume, end diastolic pressure, systemic and pulmonary mean arterial pressure, systemic and pulmonary mean venous pressure, and systemic and pulmonary arterial pulse pressures [21, 24, 25, 30, 31]. In total, the lumped circulatory model invokes 8 additional adjustable parameters of which 6 are estimated by fitting essential circulatory parameters from literature (listed in Table 1) and 2 are set such that shape of model predicted LV pressure-volume loop is similar to in vivo measurements [25]. All these parameters values are listed in Table D.1.
Metabolite concentrations in healthy and failing myocardium
Metabolite concentrations ([MgATP], [MgADP], and [Pi]) were computed from the model of Wu et al. [3] assuming normal metabolite pool concentration for the normal control state, and setting the adenine nucleotide (TAN), total exchangeable phosphate (TEP), and total creatine pools (CRTOT) to the level associated with severe decompensated hypertrophy for the heart failure case. For the normal case TAN = 8.62 mM, TEP = 29.8 mM, and CRTOT = 36.0 mM [3]. For the failure case, TAN = 4.35 mM, TEP = 21.3 mM, and CRTOT = 22.7 mM [3]. It is further assumed that the normal baseline ATP hydrolsysis rate in rat is 58% of the maximum rate because the resting heart rate in rat is approximately 58% of maximum in rat. This resting ATP hydrolysis rate corresponds to a rat of oxygen consumption (MVO2) of approximately 6 μmol min−1 (g tissue) −1. The coresponding computed cytoplasmic phosphate metabolite concentrations for normal and heart failure conditions are listed in Table 2.
Table 2.
Metabolite concentrations
| Parameter | Normal | Heart Failure |
|---|---|---|
| Metabolite pools (fixed parameters) | ||
| TAN, total adenine nucleotide | 8.62 mM | 4.32 mM |
| TEP, total exchangeable phosphate | 29.8 mM | 21.3 mM |
| CRTOT, total creatine pools | 36.0 mM | 22.7 mM |
| Phosphate metabolites (computed from model) | ||
| [ATP], cytoplasmic | 8.0 mM | 1.6 mM |
| [ADP], cytoplasmic | 18 μM | 4 μM |
| [Pi], cytoplasmic | 0.6 mM | 4 mM |
These model-predicted cytoplasm ATP, ADP, and Pi concentrations have been shown to match the concentrations observed in vivo in dogs under normal conditions in in decompensated hypertrophy in a pressure overload model [3].
ATP hydrolysis rate
The cross-bridge cycling model, shown in Fig. 1B, includes a irreversible step therefore the rate of ATP hydrolyzed per unit time can be computed using: [15]. From the CVS model (mean ATPase rate) per unit time is computed and converted into [ATP] hydrolyzed per unit time per gram cardiac tissue (ρ) using the following relationship: where is the number of cross-bridges per g tissue[32], NA is the Avogadro’s constant.
Cardiac Efficiency
Left ventricular work per beat is computed as area of the left-ventricular pressure-volume loop. The energy provided by ATP hydrolysis is computed as the ATP hydrolysis potential (taken as 100 zJ [32]) multiplied by the predicted number of ATP molecules hydrolyzed per beat in the LV free wall and septum. Efficiency is computed work per beat divided by energy provided by ATP hydrolysis. Note that this calculation ignores the contribution to ATP hydrolysis of other cellular processes such as ionic pumps. Thus this measure of efficiency represents the fraction of the chemical energy dissipated by ATP hydrolysis of cross-bridge that is transferred to ventricular work.
Action of myosin-activating drug omecamtive mecarbil
Administration of a myosin-activating drug omecamtive mecarbil (OM) is simulated in the myofilament model by assuming that the drug increases the rate of myosin head binding with the actin filament [33]. Specifically, we simulated the hypothetical mechanism of OM by increasing the rate of myosin-head attachment with actin (parameter ka in Table B.1) by 200% with 10−4 mol/L OM, in accord with the mechanism proposed by Malik et al. [34].
Results
Figure 2A illustrates calcium transient data from Janssen et al. [19] obtained at SL = 2.2 μm and 4 different frequencies. These measured calcium time course data were used to drive the model to obtain the model-predicted tension time courses shown in Figure 2B. The lower frequencies of stimulation are associated with relatively low peak calcium, resulting in a relatively lower peak tension. As frequency increases the time to peak and relaxation time decrease. These data are used to identify the calcium activation component of the crossbridge model by extracting the quantities RT50, TTP and Tdev and fitting them to data from Janssen et al. [19]. Figure 3 shows the model fits to data on RT50, TTP and Tdev as functions of sarcomere length and stimulation frequency.
Figure 2.
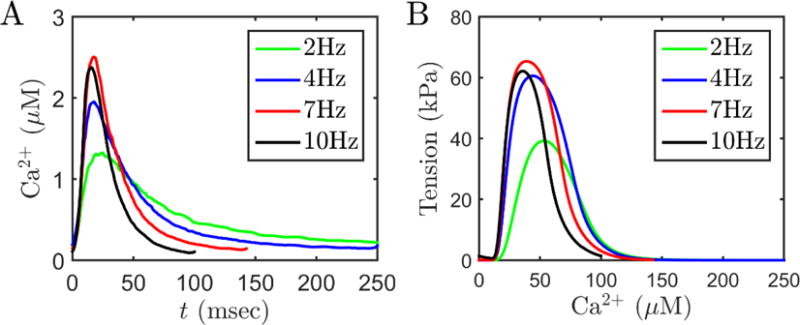
Calcium and tension transients in rat cardiac muscle. A. Representative time courses of Ca2+ data used to drive the myofilament model. Frequency dependent acceleration of relaxation is clearly visible. Data are from Janssen et al. [19]. B. Model simulated tension transients were used to compute TTP, RT50 and Tdev. For these simulations, SL is fixed at 2.2 μm, temperature is 37.5 °C and metabolite concentrations are: MgATP = 8 mM; MgADP = 18 μM; Pi = 0.6 mM (representative of resting level metabolites concentrations under physiological conditions).
Figure 3.
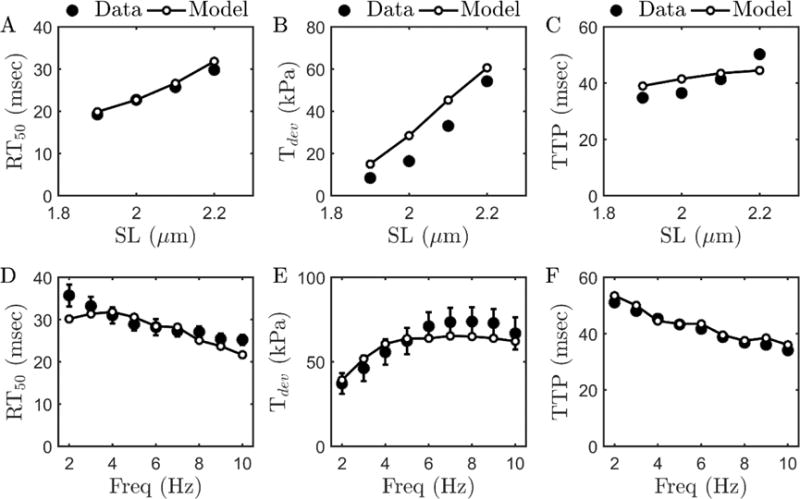
Model fits to force-frequency-length data [19] from rat cardiac muscle obtained at 37.5 °C using the myofilament model. (A, B, C) show RT50, Tdev, and TTP data obtained at four different muscle lengths corresponding to SL’s of 1.9, 2.0, 2.1 and 2.2 μm. Stimulation frequency for these experiments was 4Hz. (D, E, F) RT50, Tdev, and TTP data obtained at optimal length (corresponding to SL of 2.2 μm) with different stimulation frequencies (2–10Hz). Metabolite concentrations are fixed to the physiological concentration as in Figure 2. Error bars shown in (D) and (E) represent standard error from the n=9 dataset [19].
The quantities RT50, TTP and Tdev are computed from tension transient in response to a Ca2+ pulse which depends on frequency of electrical stimulation (and muscle length). The observed relationship between tension, frequency, and length provides more information for model identification than steady-state Tension-pCa-length relationships [19, 35]. The rat myofilament model that is identified from these data captures the effect of SL and stimulation frequency (D, E, F) on RT50, TTP and Tdev data reasonably well at physiologically relevant frequencies.
Myofilament model reproduces SL dependent decrease in Ktr
Milani-Nejad et al. [20] reported the effect of initial muscle length on rate of force redevelopment (Ktr) in intact rat cardiac muscle at body temperature. Data from these experiments are illustrated in Figure 4A, showing the measured tension transient that follows a length transient where the muscle is rapidly shortened to 80% of initial length Lo, maintained at the new length for 10 msec, and then rapidly brought back to the initial length. When the muscle is shortened, the tension drops, and recovers when the muscle is re-stretched to the initial length. The rate of redevelopment of tension (denoted Ktr) depends on the rate of crossbridge turnover at a given calcium concentration.
Figure 4.
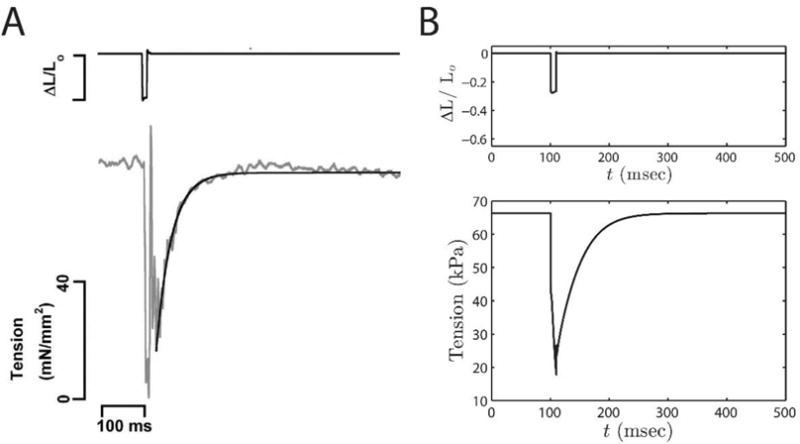
Tension development in slack-restretch experiment and model simulations. A. Experiments (figure reproduced from Milani-Nejad et al. [20], pending permission) performed in intact rat cardiac muscle at body temperature. B. Model simulations of the experiments. The exponential increase in force is used to compute Ktr. Metabolite concentrations are set to: MgATP = 5 mM, MgADP = 16 μM, and Pi = 0.5 mM; temperature is set to 37 °C and Ca2+ is set to 1 μM. For the simulations shown here Lo = 2.2 μm.
Simulation of this experiment provides an opportunity to validate the myofilament model against data not used to identify it. To simulate these experiments at SL is initially held isometrically and isotonically at the given length Lo. At the beginning of the shortening phase, SL is instantaneously reduced to 80% of Lo. Sarcomere length is held at 0.8 Lo for 10 ms, and then returned to initial length. Metabolite concentrations are set to: MgATP = 5 mM, MgADP = 16 μM, and Pi = 0.5 mM; temperature is set to 37 °C and Ca2+ is set to 1 μM, corresponding to the experimental conditions of Milani-Nejad et al. [20]. All other parameters are as listed in Table B.1. The rapid shortening disrupts the attached cross-bridges and force falls to nearly zero. Cross-bridges re-attach and force is redeveloped at an exponential rate once the initial length is restored.
The experimental protocol was performed at two initial muscle lengths: optimal muscle length (Lopt, corresponding to a sarcomere length of 2.2 μm), and length 90% of Lopt (L90). To quantitatively compare to the experimental data, the simulated restoration phase of force is fitted to the function: where F = force, Fmax = maximum force, Finit = initial force, and α denotes the rate of force redevelopment (i.e., Ktr). The model predicted Ktr values for Lopt and L90 are similar to the values reported by Milani-Nejad et al.: 27.25 sec−1 (model) vs 27±3.3 sec−1 (data is from [20]) at Lopt; 49.06 sec−1 (model) vs 45.1 ± 7.6 sec−1 (data is from [20]) at L90.
The ability of the model to match the observed rates of force generation at different sarcomere lengths is important because this behavior will determine the rate of ventricular pressure development in the integrated model and the sarcomere length will be different for different preloads.
Whole-body phenotype: Effect of metabolites and a myosin-activating drug
Figure 5 illustrates the behavior of the integrated CVS model, showing left and right ventricular pressures and volumes, and aortic and pulmonary arterial pressure obtained with physiological metabolite concentration and the 7-Hz Ca2+ transient driving active tension generation by the myofilaments. Simulated Frank-Starling curves and pressure-volume loops are shown in Figure 6. The Frank-Starling curves (cardiac output as a function of pulmonary venous pressure) are generated by loading/unloading volume from the circulatory system. After loading/unloading the circulatory system, the CVS model is simulated for sufficiently long time (200 cardiac cycles) to reach a steady state.
Figure 5.

(A) Model simulations of LV pressure (solid line) and LV volume. (B) RV pressure (solid line) and RV volume (dashed line). Simulations are performed using the CVS framework shown in Figure 1C. Ca2+ transient data, obtained at 7Hz stimulation frequency, is used to drive the myofilament kinetics which in turn drives heart mechanics.
Figure 6.
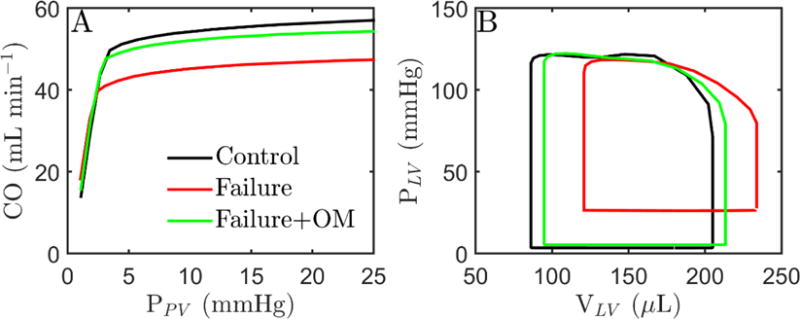
Effect of metabolites and myosin activation on cardiovascular state. CVS model is simulated using Ca2+ transient obtained at 7Hz stimulation frequency. A. Frank-Starling curves computed at different preloads under control conditions (black curve), failing-heart conditions (red curve) and failing-heart conditions with 10−4 mol/L OM (green). B. LV pressure-volume curve with same conditions as in A except at different preload (black: ~3 mmHg, red: ~20 mmHg, green: ~4 mmHg). CO under three condition is (in units of mL min−1): 50 (black), 48 (red) and 50 (green).
The predicted relationship between cardiac output and filling pressure is illustrated for two different metabolic conditions, one representing the normal phyisological resting state (see Table 2). Under control conditions the curve follows the expected Frank-Starling relationship with cardiac output increasing with increasing preload, which increases diastolic filling of the heart. Under failing-heart metabolite conditions the predicted response of cardiac output to increasing preload is blunted. Simulations predict that cardiac output falls below the normal level of 50 mL min−1 for the whole range of preload. To compute pressure-volume loops for the heart-failure case it was assumed that the blood volume expands to increase filling pressure to 20 mmHg, resulting in a cardiac output of 48 mL min−1 (96% of normal). The resulting pressure-volume loops predict that congenstion associated with the failing metabolic state causes a dilation of the left ventricle, even in the absence of any structural remodeling of the heart. The heart-failure case simulations show elevated end-diastolic pressure (20 versus 3.5 mmHg for control) and reduced ejection fraction (0.48 versus 0.58 for control), matching the definition of systolic dysfunction.
Simulation predictions for failure conditions with OM adminstration are plotted as green traces in both panels of Figure 6. Predicted pressure-volume loops with OM are calculated by reducing blood volume from that used in the failure conditoin to obtain a cardiac output equal to the control level. The action of OM is predicted to return the Frank-Starling curve close to the control conditions, reduce venous congestion, and restore normal cardiac/cardiovascular state. The potential effects of increaseing the cross-bridge attachment rate are examined in more detail in Figure 7, which plots the predicted rate of work done by the LV, myosin ATPase flux in the LV free wall, the mean systemic arterial pressure, and pulmonary venous pressure as functions of ka, the kinetic parameter assumed to be affected by OM. For these simulations the blood volume in the closed-loop circulatory model is adjusted to maintain cardiac output constant at 48 mL min−1 for heart-failure conditions and 50 mL min−1 for control. As a result the predicted pulmonary venous pressure decrease as ka is increased and venous pressure decreases for the failure case.
Figure 7.

Effects of myosin activation on cardiac work and ATP hydrolysis. A. Predicted rate of work done by LV (pressure-volume area multiplied by heart rate) is plotted as a function of relative value of the cross-bridge attachment rate parameter ka for conrol and failure conditions. B. The predicted rate of myosin ATPase flux in the LV free wall is plotted as a function of the value of ka. C. Mean systemic arterial (PA) and pulmonary venous (PPV) pressures are plotted as functions of the value of ka. For all simulations blood volume in the closed-loop circulatory system is adjusted to maintain approximately normal cardiac output, as described in the text. The baseline value of ka (294.1 sec−1) reflects the normal value from Table D.1.
At the normal value of ka (294.1 sec−1), both the work done by the LV (pressure-volume area multiplied by heart rate) and the rate of ATP hydrolysis are impaired under heart failure conditions compared to control. Figure 7A shows that the work done by the LV is restored to nearly match the control conditions by doubling ka for the simulation of the failure conditions. Figure 7B shows that increasing ka has the effect of increasing the myosin ATPase flux for both normal and heart failure conditions. These simulations predict that doubling of ka reduces stroke work by 1.5% and increases myosin ATPase flux by 10% for control metabolite conditions, while both work rate and ATP hydrolysis rate are increased by increasing ka for the simulation of failure conditions.
Discussion
A multi-scale model was developed to predict the impact of metabolic/energetic changes in the myocardium on whole-body cardiovascular function in heart failure. A cell-level model of rat myocardial mechanics was identified based on data obtained from rat cardiac muscle at 37.5 °C [19].This mechanics component of the model was integrated with previously developed model of myocardial energy metabolism [3], in order to predict how alterations to energetic state influence cell mechanics. The cell model was then incorporated in a computationally inexpensive and physiologically realistic model of heart which accounts for geometry, and mechanical interation of LV wall, RV wall and septum [16]. The realistic heart model was in turn coupled with a simple lumped circulatory model identified to match experimentally reported values of CO, EF, EDV, SV, MVP (systemic and pulmonary), MAP (systemic and pulmonary) and APP (systemic and pulmonary) for rat [21, 24, 25, 30, 31]. The resulting CVS model provides a vehicle for predicting how metabolic changes, in isolation from other remodeling, may or may not influence the whole-body phenotype in decompensated hypertrophy/heart failure. In addition, the multi-scale integration provides a platform integrating drug effects into whole-body simulations, both to make predictions of how specific compounds affect whole-body phenotype and to determine molecular targets to achieve a desired effect on whole-body phenotype.
Force-Frequency-Length Relationship
Myofilament length-dependent activation (LDA), known to underlie Frank-Starling mechanism, is an increased myofilament sensitivity to cytosolic Ca2+ at increased sarcomere lengths [36]. The phenomenon of LDA depends not only on cytosolic Ca2+ concentration, but also on frequency of stimulation (rate of beating heart) and post-translational modifications of myofilament or sarcolemmal proteins. The myofilament activation model accounts for the frequency-dependent effects by matching the data from Janssen et al. [19] reasonably well at physiologically relevant frequencies. Yet the model does underestimates the increase in TTP with increasing SL (Figure 3C), indicating that there is room for improvement in accounting for these phenomena in future studies.
Metabolic contribution to mechanical phenotype
It has been hypothesized that altered metabolite concentrations observed in heart failure affect cardiac contractility and impair ion homeostasis [7, 8, 37]. Our simulations predict that the depletion of metabolic pools observed in severe decompensated hypertrophy [3] can profoundly effect on cardiac function in vivo. Imposition of the failure metabolic phenotype on the myocardium in the whole-body simulation causes a reduction in CO, requiring a substantial increase in venous pressures to approach normal resting CO (Figure 6A). Reduced ATP and increased Pi concentrations in the heart failure model impede cross-bridge cycling and reduce sarcomere sliding velocity [15], resulting in reduced systolic function. Thus the integrated model provides the first illustration of how metabolic changes observed in heart failure (and resulting changes in myocardial energetic state) may alone be sufficient to induce systolic dysfunction and whole-body heart failure symptoms.
Effects of myosin activating drugs
The baseline drug therapy in patients with systolic heart failure involves usage of drugs that target the renin-angiotensin-aldosterone system [38]. The basic idea is to reduce preload and afterload of the heart to prolong life. Omecamtiv mecarbil (OM), a drug activating the myosin ATPase force production without altering cellular Ca2+ handling, has been proposed as a potential therapy for patients with systolic heart-failure [34, 39].
The ability of OM to ameliorate the effects of metabolic pool depletion is illustrated in Figures 6 and 7. As expected, addition of OM improves function in the failure case, partially compensating for the metabolic changes. The drug is also predicted to cause an increase in myosin ATPase ATP utilization. This prediction is consistent with recent studies reporting increases of 33% in dogs [17] and 24% in pigs [18] in MVO2 after administrating OM to animals with ischemic heart disease. The observed increases in MVO2 associated with OM administration raise the concern of the drug causing a reduction in mechanical efficiency. Our model predicts that OM administration decreases efficiency (work done per ATP hydrolyzed by myosin ATPase) by 10% under healthy conditions but increases efficiency by 20% under failure metabolic conditions. This is because under failure conditions, the model predicts that OM increases both work rate and ATP utilization rate.
Increasing ka has little effect on work done in the control case because under normal conditions the rate of cross-bridge cycling is well balanced to the efficiently do work during the normal cardiac cycle. The rate and peak of tension development increase with increasing cross-bridge cycle rate, but at the cost of increased rate of ATP hydrolysis. Thus, under otherwise normal conditions an increase in the rate of cross-bridge cycling results in a reduction in efficiency. For heart-failure conditions, on the other hand, metabolic impairment of cross-bridge cycling reduces both work rate and ATP hydrolysis rate compared to control. Increasing the cross-bridge cycle rate by increasing ka increases both ventricular work and ATP hydrolysis rate, restoring the system towards its normal operating point. Consistent with these model predictions, Bakkehaug et al. [18] find that OM administration reduces stroke work by 18% in healthy pigs while increasing MVO2 by 10%. These predictions are also consistent with recent clinical studies and may help explain myocardial ischaemia observed in some patients with high plasma concentations of OM [39].
Limitations of the current study
One of limitations of the current study is that it does not account for the effects of metabolite pool depletion on plasma-membrane ATPases and sarcoplasmic endoplasmic reticulum Ca2+ ATPase (SERCA). Alterations of these ATPases may lead to impaired Ca2+ homeostasis which in turn would affect myofilament and heart function. In the absence of this feedback, it is not clear whether an altered Ca2+ homeostasis will improve or aggravate our model predictions of cardiac efficiency in response to metabolic dysfunction and OM treatment. In any case, the current study demonstrates that even in the absence of altered Ca2+ kinetics the effect of metabolite pool depletion on myofilaments kinetics induces venous congestion to clinically relevant values.
Summary and Conclusions
Simulations of integrated cardiac myofilament mechanics, metabolic state, whole-organ heart mechanics, and closed-loop cardiovascular dynamics in rat predict:
Changes in phosphate metabolite concentrations (ATP, ADP, and Pi) that are observed to occur in decompensated cardiac hypertrophy impair force/tension development in the heart through a direct effect on myofilament cross-bridge cycle kinetics.
The resulting impairment in wall tension development leads to systolic dysfunction. Thus, the direct impact of the impaired metabolic state on myocardial mechanics does potentially represent a causal factor contributing mechanical dysfunction in heart failure.
The metabolic inhibition of the cross-bridge cycle associated with failing myocardium may be ameliorated by drugs that stimulate cross-bridge cycle turnover.
These predictions are based on model simulations in which metabolic/energetic dysfunction is isolated from all other remodeling processes that occur in decompensatory hypertrophy. It remains unclear if the direct impacts of impaired metabolic state on myocardial mechanics would be magnified or diminished by accounting for additional important factors such as altered calcium handling, and structural remodeling of the heart. Furthermore it remains unclear if or how these findings (based simulations of a model parameterized to represent rat cardiovascular function) will translate to large animals and humans with myocardial cross-bridge cycle turnover rates that are much lower than those for rodents.
Highlights.
A computer model of rat cardiac myofilament mechanics predicts that myocardial metabolic changes associated with heart failure impeded contractile function.
Integration of the cardiomyocyte model into models of whole-organ cardiac mechanics and whole-body circulation predicts that changes in phosphate metabolite concentrations that are observed to occur in heart failure may directly impair systolic function in vivo.
The metabolic inhibition of the cross-bridge cycle associated with failing myocardium may be ameliorated by drugs that stimulate cross-bridge cycle turnover.
Acknowledgments
Funding
The authors acknowledge the financial support by the National Institutes of Health (National Institute of General Medical Sciences award P50-GM094503 and National Heart, Lung, and Blood Institute award HL072011).
Appendix
Appendix A: Mathematical model of the myofilament
The mathematical framework of the sarcomere model is a coupled version of Tewari et al. [15] and Rice et a. [26] models. The following changes were made to the Rice model: i) the length of thick filament, Lthick was changed from 1.65 to 1.67 μm [27] and ii) force-dependent unbinding of Ca2+ from troponin C (TrpC) [28] was added. The thick-thin filament overlap function is adopted from Rice et al. [26]:
| (I) |
Here, Lthick is the length of thick filament, SL is length of sarcomere, Lbare is the length of the bare region of thick filament, Lthin represents length of actin filament length. OVZ-axis is the overlap region closest to the Z-axis and OVM-line is the overlap region closest to the M-line. Using length of overlap (LOV), fraction of thick and thin filament overlap is computed as:
| (II) |
Figure A.1.
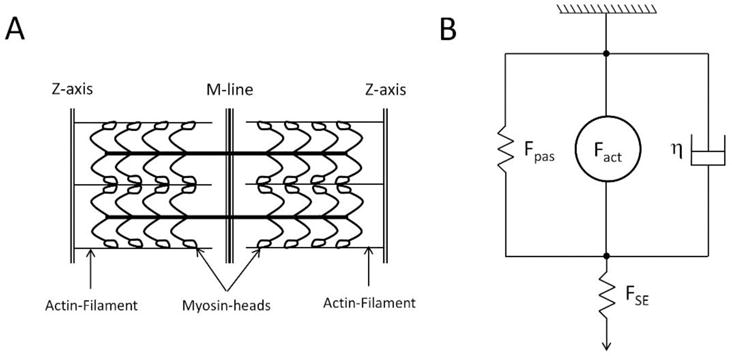
A. Schematics of sarcomere geometry. Actin filaments have equal length in each half-sarcomere. Myosin-heads are attached on the thick filament which runs across the sarcomere. Along the M-line is region where there are no myosin-heads (also known as the bare region). It is assumed that length of thick-thin filament overlap influences binding affinity of Ca2+ with TrpC and hence affects forward cross-bridge cycling. B. Mechanics of cardiac muscle force generation. Fpas represents passive forces of the cardiac muscle due to titin or collagen, Fact is the active force generated due to myosinactin interaction, η is the viscosity of the cardiac muscle, and FSE = KSE (SLset − SL) is the force due to series elastic element used to simulate isosarcometric contraction. KSE is the stiffness of series element; SLset is the set sarcomere length and SL is the sarcomere length.
The overlap fraction of thin filament (OVthin) is used to affect the binding affinity of Ca2+ for TrpC and hence affect transition from non-permissible (N) to permissible (P) cross-bridge state (see Figure 1B):
| (III) |
Here, and βNtoP βPtoN are phenomenological functions adopted from Rice et al.[26] to increase/decrease the transition rate from non-permissible to permissible cross-bridge state depending upon OVthin and Ca2+ bound with low-affinity (CaL) and high-affinity TrpC (CaH):
| (IV) |
The overlap fraction of thick filament (OVthick) is used as a scaling factor that increases/decreases the active force generated by cross-bridges (FXB) depending upon thick-thin filament overlap i.e. Fact = OVthick FXB. The mechanics of cardiac muscle (shown in Fig A.1B) are governed by:
| (V) |
Fact represents active forces due to myosin-actin interaction, Fpas represents passive forces due to titin and/or collagen (formulation from Rice model[26]), FSE (= KSE(SLset − SL)) is a series elastic element used to simulate isosarcometric shortening of sarcomere, KSE is the stiffness of the series elastic element set such that internal shortening is minimal, SLset is the set sarcomere length which depends on the simulated experiment, η represents the viscosity coefficient of sarcomere, and Fpre is the force needed to stretch cardiac muscle above resting sarcomere length.
Appendix B: Force dependent Ca2+ unbinding from TrpC
Ca2+ bound with low-affinity (CaL) and high-affinity (CaH) TrpC is calculated using:
| (VI) |
Here, kon is the binding rate of Ca2+ for TrpC, koffL and koffH are the unbinding rate of Ca2+ from high and low affinity TrpC, Qkon and Qkoff represent the temperature dependence of the binding/unbinding rates. The factor f (σ) defines the force-dependent unbinding rate of Ca2+ from TrpC which is supported by previous experiments [40, 41] and was necessary to fit the Janssen data [19]. It has the following formulation:
| (VII) |
ζ is a scaling factor that determines effect of force on Ca2+ unbinding rate, FXB is the force generated due to cross-bridges (formulation is as given in Tewari et al.[15]), is the theoretical maximum of force determined using the King-Altman method[42]:
| (VIII) |
All the rate constants, in Eqn. (VIII), and their definitions are same as defined by Tewari et al. [15] for rat cardiac muscle. All parameter values, estimated or fixed, along with their description are shown in Table B.1.
Table B.1.
List of parameters estimated/used for the myofilament model
| Parameter | Description | Value | Reference |
|---|---|---|---|
| Thick-thin filament activation parameters | |||
| Lthick | Length of thick filament | 1.67 μm | Gordon et al.[27] |
| Lthin | Length of thin filament | 1.2 μm | Rice et al.[26] |
| Lbare | Length of bare region of thick filament | 0.1 μm | Rice et al.[26] |
| kon | Association rate of Ca2+ with TrpC | 100 μM | Niederer et al. |
| koffL | Dissociation rate of Ca2+ from low affinity TrpC | 4218.5 sec−1 | Fit to Janssen data[19] |
| koffH | Dissociation rate of Ca2+ from high affinity TrpC | 156.5 sec−1 | Fit to Janssen data[19] |
| ζ | Force sensitivity of Ca2+ unbinding rate | 0.23 | Fit to Janssen data[19] |
| β50 | TrpReg value which the effect is half-maximal | 0.5 | Rice et al.[26] |
| nβ | Hill-coefficient of the TrpReg effect | 15 | Rice et al.[26] |
| Qkon | Temperature dependence of kon | 1.5 | Rice et al.[26] |
| Qkoff | Temperature dependence of koff | 1.3 | Rice et al.[26] |
| Cross-bridge cycling parameters | |||
| knp | Transition rate from N to P | 329.2 sec−1 | Fit to Janssen data[19] |
| kpn | Transition rate from P to N | 50 sec−1 | Rice et al.[26] |
| ka | Myosin-actin rate of attachment | 294.1 sec−1 | Tewari et al.[15] |
| kd | Myosin-actin rate of detachment | 88.9 sec−1 | See footnote† |
| k1 | Transition rate from A1 T to A2 T | 10.2 sec−1 | Tewari et al.[15] |
| k−1 | Transition rate from A2 T to A1 T | 10.3 sec−1 | Tewari et al.[15] |
| K2 | Transition rate from A2 T to A3 T | 88.6 sec−1 | Tewari et al.[15] |
| k−2 | Transition rate from A3 T to A2 T | 20.9 sec−1 | See footnote‡ |
| k3 | Transition rate from A3 to P | 35.6 sec−1 | Tewari et al.[15] |
| α1 | Stretch sensing parameter for k1 and k−1 | 10 μm−1 | Tewari et al.[15] |
| α2 | Stretch sensing parameter for k2 and k−2 | 9 μm−1 | Tewari et al.[15] |
| α3 | Stretch sensing parameter for k3 | 59.3 μm−1 | Tewari et al.[15] |
| s3 | Strain at which k3 is minimum | 9.9 nm | Tewari et al.[15] |
| kstiff,1 | Stiffness of frictional forces arising due to myosin-actin interaction | 2827.1 kPa μm−1 | Tewari et al.[15] |
| kstiff,2 | Stiffness of forces arising due to cross-bridge powerstroke | 51871 kPa μm−1 | Tewari et al.[15] |
| QkNtoP | Temperature dependence of kNtoP | 1.6 | Rice et al.[26] |
| QkPtoN | Temperature dependence of kPtoN | 1.6 | Rice et al.[26] |
| QXB,1 | Temperature dependence of ka, k1 | 3.82 | Fit to data[19] |
| QXB,2 | Temperature dependence of kd, k−1 | 2.39 | Fit to data[19] |
| QXB,3 | Temperature dependence of k2, k3 | 6.73 | Fit to data[19] |
| QXB,4 | Temperature dependence of kstiff,1 | 1.34 | Tewari et al.[15] |
| QXB,5 | Temperature dependence of kstiff,2 | 1.44 | Tewari et al.[15] |
| Other parameters | |||
| λXB | Factor scaling cross-bridge force | 1.31 | Fit to CVS data[25]; See Footnote‖ |
| KSE | Stiffness of series element | 1000 kPa μm−1 | See text |
| η | Viscosity coefficient of cardiac muscle | 1 kPa sec μm−1 | Fixed |
Scaled by a factor of 2.5 from original published value to make kd/ka same as mouse XB mouse [15]. Note, that experimental data with variable Pi was only available for mouse myocardial strips (see Tewari et al. [15]).
Scaled by a factor of 10 from original published value to make k−2 of same magnitude as k2. Note, no experimental data was available with variable ADP and model was relatively insensitive to this parameter (see Tewari et al. [15]).
Scaling factor used to consolidate differences between myofilament force generation in vivo and in vitro. It was used only while simulating the CVS model.
Appendix C: Passive force formulation
The passive force formulation used during all model simulations is adopted from Rice et al. [26]:
Here, PContitin, PExptitin, PConcollagen, PExpcollagen, SLcollagen, and SLrest are as initially defined by Rice et al.[26] The σpas is a scaling factor used to obtain units of force. Parameter values are listed in Table C.1. A preload term is used during simulation of slack-restretch experiments:
where SLo is the length of the sarcomere at which it is held before slack-restretch.
Table C.1.
List of parameters used for passive force generation
| Parameter | Description | Value | Reference |
|---|---|---|---|
| SLrest | Resting sarcomere length | 1.9 μm | Rice et al.[26] |
| PContitin | Contribution of titin | 0.002 (Normalized force) | Rice et al.[26] |
| PExptitin | Expression of titin | 10 unitless | Rice et al.[26] |
| PConcollagen | Contribution of collagen | 0.02 (Normalized force) | Rice et al.[26] |
| PExpcollagen | Expression of collagen | 70 unitless | Rice et al.[26] |
| SLcollagen | Threshold for collagen activation | 2.25 μm | Rice et al.[26] |
| σpas | Maximum passive stress | 7 kPa | Lumens et al.[16] |
Appendix D: Heart mechanics
TriSeg model is modified to include active force generation from the myofilament model (identified from Jansen et al. [19]) and passive force generation from the Rice et al. model [26]. LV, RV and septum wall are assumed to have a single myofiber with same active and passive mechanical properties. Myofiber length changes within a wall (i.e., LV, RV or Septal) are governed by:
| (IX) |
Here, FSE (=KSE (Ls −Lsc)) is the afterload on the wall accounting for ventricular interaction and filling. KSE represents stiffness of the series elastic element, Ls is the sarcomere length, Lsc is the length of the contractile element and λXB is a scalar used to account for differences in force generation properties of myofilament in vivo and in vitro. The stiffness of the series elastic spring (KSE) is chosen such that Ls ≈ Lsc. Fpas is the passive force arising due to titin/collagen. Fact is the active force due to filament overlap and XB cycling. Ls represents sarcomere length calculated from natural myofiber strain [16, 43]:
| (X) |
Here, Am is the midwall surface area, Am,ref is a reference midwall surface area, Cm is the curvature of the midwall surface, Vw is the wall volume of wall segment (determined from experiments), Vm is the midwall volume, and xm, ym determine the geometry of the LV and RV cavity (see Figure D.1). For a given, wall volumes and ventricular volumes, the geometry of the heart is solved such that equilibrium of radial and axial tensile forces is achieved at the junction margin (i.e., where the three wall segments meet forming ventricular cavities).
Figure D.1.
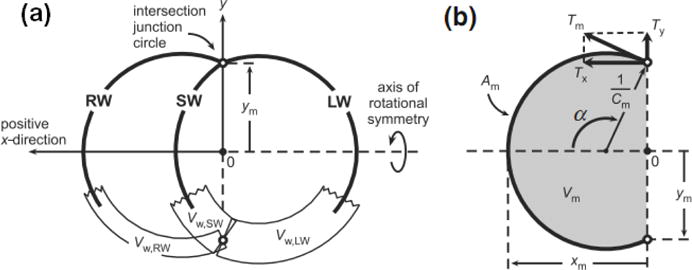
Geometry of the heart model used to simulate ventricular interaction. Modified and reproduced from Lumens et al. [16] (pending permission).
Tension in the midwall is calculated using:
| (XI) |
This midwall tension is used to compute axial and radial tension components:
| (XII) |
Transmural pressure is given by: which also yields LV and RV pressure:
Lastly, the geometry of LV and RV cavity (i.e. xm and ym) is adjusted such that:
Table D.1.
Parameters estimated/used for simulating the CVS model
| Parameter | Description | Value | Reference | |
|---|---|---|---|---|
| Circulatory Parameters | ||||
| RPV | Pulmonary vasculature resistance | 19.2 mmHg sec mL−1 | Fixed | |
| RSV | Systemic vasculature resistance | 117.6 mmHg sec mL−1 | Fixed | |
| RAo | Aortic resistance | 1.96 mmHg sec mL−1 | Arbitrarily set | |
| CAo | Aortic compliance | 0.00015 mL mmHg−1 | Arbitrarily set | |
| CSA | Systemic artery compliance | 0.0035 mL mmHg−1 | Fit to CVS data | |
| CSV | Systemic vein compliance | 19.33 mL mmHg−1 | Fixed | |
| CPA | Pulmonary artery compliance | 2.42 mL mmHg−1 | Fit to CVS data | |
| CPV | Pulmonary vein compliance | 0.009 mL mmHg−1 | Fixed | |
| τCO | Mean cardiac output time constant | 5 sec | Fixed | |
| τPA | Mean pulmonary artery time constant | 30 sec | Fixed | |
| τSA | Mean systemic artery time constant | 30 sec | Fixed | |
| TriSeg parameters | ||||
| Vw,lw | LV wall volume | 0.4653 mL | Determined from experiments | |
| Vw,sw | Septal wall volume | 0.2506 mL | Determined from experiments | |
| Vw,rw | RV wall volume | 0.1933 mL | Determined from experiments | |
|
|
LV midwall reference surface area | 1.38 cm2 | Fit to CVS data | |
|
|
Septal midwall reference surface area | 0.78 cm2 | Fit to CVS data | |
|
|
RV midwall reference surface area | 2.18 cm2 | Fit to CVS data | |
| Other parameters | ||||
| KSE | Stiffness of series element | 5000 mmHg μm−1 | See text | |
| visc | Viscosity coefficient of myofibers | 1 mmHg sec μm−1 | Fixed | |
Appendix E: Force-Calcium-Length experiments and simulations
Model simulations of force-calcium-length experiments are shown in Figure S2. Hill coefficient value and Ca50 are determined from model simulations by fitting to a Hill function of type: where, nH denotes Hill coefficient and Ca50 is the calcium concentration at which force is halved. Model simulated Hill coefficients are slightly higher than the values reported by Dobesh et al. [44] but are relatively constant at higher sarcomere length in agreement with Dobesh et al. [44]. Note that the calcium sensitivity of the model simulation Tension-pCa curve and data are a magnitude apart (see Figure E.1) which is also reflected in the differences in Ca50 values. These differences may be explained by recalling that the myofilament model parameters are identified from intact rat cardiac muscle whereas Dobesh et al. [44] performed their experiments on skinned rat cardiac muscle.
Figure E.1.
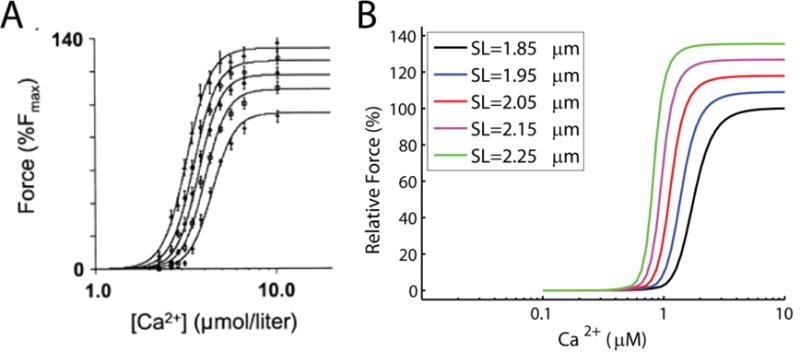
Force calcium length experiments and model simulations. (A) Force-calcium-length experiments from skinned rat cardiac muscle (figure reproduced from Dobesh et al. [44], pending permission). (B) simulations of the experiments using identified myofilament model. Experiments were done at sarcomere lengths of 1.85, 1.95, 2.05, 2.15 and 2.25 μm. Force responses are reported with respect to the maximum force obtained at sarcomere length of 1.85 μm. Model simulations are done with ATP = 5mM, ADP = 0mM, and Pi = 0mM.
Table E.1.
Model and Data comparison
Appendix F: Effect of muscle length on force transient
The ability of the myofilament model to increase calcium sensitivity in response to muscle length changes is illustrated in Figure F.1, showing simulations of force generated in response to a calcium transient of 4Hz. The model qualitatively mimics the increase seen in force in response to increase in sarcomere length.
Figure F.1.
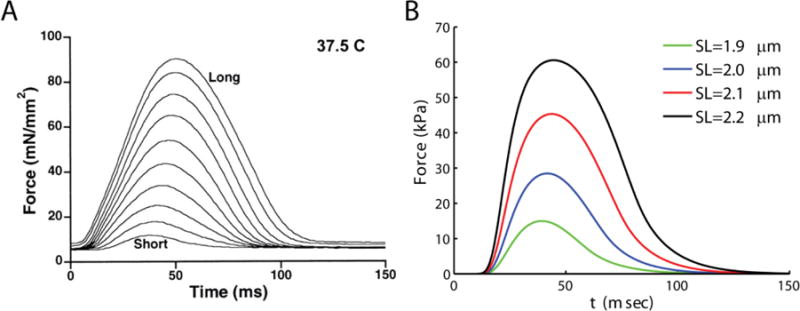
Model mimics the effect of increasing muscle length on developed force and force transient. A. Experimental data showing increases in force with increasing muscle length (Figure reproduced from Janssen et al.[19], pending permission). B. Model simulations of the effect of increasing sarcomere length on force transients. Cardiac muscle model is held at sarcomere lengths indicated in the legend and stimulated at a frequency of 4 Hz. The stiffness of the series elastic element allows iso-sarcometric shortening (KSE = 1000 kPa/μm). The model effectively matches the increase in force and increase in time-to-peak force seen in the experiments (A).
Appendix G: Effect of metabolites and calcium on force development
Metabolites (such as, ATP, ADP, Pi) and calcium have been shown to alter the rate of force development in vitro [45–48]. Our previous model of cross-bridge kinetics could mimic the effect of ATP, ADP and Pi over rate of force development but not calcium and temperature for rat cardiac muscle [15]. In order to identify temperature and calcium dependence on rate of force development in the current model, experimental data from Janssen et al. [19] were fitted and parameters associated with myofilament activation were identified. Figure G.1(A–C) shows that the modified model still matches the observed effects of metabolites on the rate of force development.
Figure G.1.
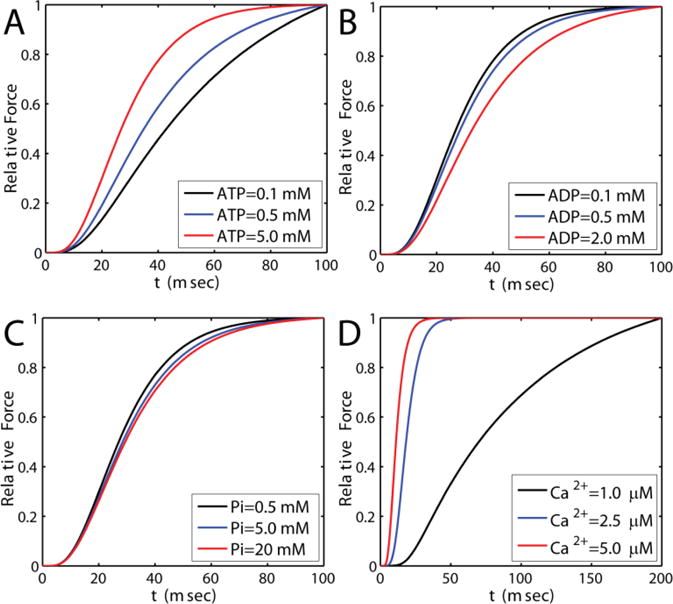
Model simulations capturing the effect of ATP, ADP and Pi on rate of force development. A. ADP = 0mM, Pi = 0mM. ATP is as shown in the legend. B. ATP = 5mM, Pi = 0mM. ADP is as shown in the legend. C. ATP = 5mM, ADP = 0mM, and Pi is as shown in the legend. Temperature is 20 °C and Ca2+ is 15 μM. D. ATP = 5mM, ADP = 0 mM, Pi = 0mM and Ca2+ as shown in the legend. Temperature is 20 C.
Appendix H: Effect of temperature on force of development
Milani-Nejad et al.[41] reported increases in Ktr values with temperature. Here we simulate the effect of increasing temperature on rate of force development. Ktr values are determined using the method presented in the main-text. At temperature 27, 32 and 37 °C, model predicts Ktr values of (units of sec−1): 10, 14, 27.5. Temperature sensitivity of Ktr (Q10) is calculated from: which is found to be 2.75 and is within the range reported by Milani-Nejad et al.[20] i.e. 1.9 to 2.8.
Figure H.1.
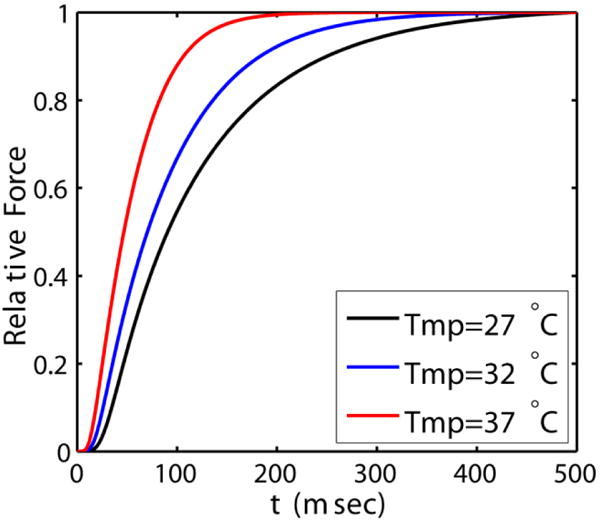
Model simulations of force development at three different temperatures (see legend). Ktr values at these temperatures are calculated by method explained in the main-text.
Footnotes
Publisher's Disclaimer: This is a PDF file of an unedited manuscript that has been accepted for publication. As a service to our customers we are providing this early version of the manuscript. The manuscript will undergo copyediting, typesetting, and review of the resulting proof before it is published in its final citable form. Please note that during the production process errors may be discovered which could affect the content, and all legal disclaimers that apply to the journal pertain.
References
- 1.Kwan M, Woo J, Kwok T. The standard oxygen consumption value equivalent to one metabolic equivalent (3.5 ml/min/kg) is not appropriate for elderly people. Int J Food Sci Nutr. 2004;55:179–82. doi: 10.1080/09637480410001725201. [DOI] [PubMed] [Google Scholar]
- 2.Wu F, Zhang EY, Zhang J, Bache RJ, Beard DA. Phosphate metabolite concentrations and ATP hydrolysis potential in normal and ischaemic hearts. J Physiol. 2008;586:4193–208. doi: 10.1113/jphysiol.2008.154732. [DOI] [PMC free article] [PubMed] [Google Scholar]
- 3.Wu F, Zhang J, Beard DA. Experimentally observed phenomena on cardiac energetics in heart failure emerge from simulations of cardiac metabolism. Proc Natl Acad Sci U S A. 2009;106:7143–8. doi: 10.1073/pnas.0812768106. [DOI] [PMC free article] [PubMed] [Google Scholar]
- 4.Conway MA, Allis J, Ouwerkerk R, Niioka T, Rajagopalan B, Radda GK. Detection of low phosphocreatine to ATP ratio in failing hypertrophied human myocardium by 31P magnetic resonance spectroscopy. Lancet. 1991;338:973–6. doi: 10.1016/0140-6736(91)91838-l. [DOI] [PubMed] [Google Scholar]
- 5.Neubauer S, Horn M, Cramer M, Harre K, Newell JB, Peters W, et al. Myocardial phosphocreatine-to-ATP ratio is a predictor of mortality in patients with dilated cardiomyopathy. Circulation. 1997;96:2190–6. doi: 10.1161/01.cir.96.7.2190. [DOI] [PubMed] [Google Scholar]
- 6.Stanley WC. Myocardial energy metabolism in dilated cardiomyopathy. Heart Metabolism. 2005;49:5–8. [Google Scholar]
- 7.Ventura-Clapier R, Garnier A, Veksler V, Joubert F. Bioenergetics of the failing heart. Biochimica et biophysica acta. 2011;1813:1360–72. doi: 10.1016/j.bbamcr.2010.09.006. [DOI] [PubMed] [Google Scholar]
- 8.Ingwall JS. Energy metabolism in heart failure and remodelling. Cardiovascular research. 2008 doi: 10.1093/cvr/cvn301. [DOI] [PMC free article] [PubMed] [Google Scholar]
- 9.Mann DL, Bristow MR. Mechanisms and models in heart failure: the biomechanical model and beyond. Circulation. 2005;111:2837–49. doi: 10.1161/CIRCULATIONAHA.104.500546. [DOI] [PubMed] [Google Scholar]
- 10.Neubauer S. The failing heart–an engine out of fuel. N Engl J Med. 2007;356:1140–51. doi: 10.1056/NEJMra063052. [DOI] [PubMed] [Google Scholar]
- 11.Ardehali H, Sabbah HN, Burke MA, Sarma S, Liu PP, Cleland JG, et al. Targeting myocardial substrate metabolism in heart failure: potential for new therapies. Eur J Heart Fail. 2012;14:120–9. doi: 10.1093/eurjhf/hfr173. [DOI] [PMC free article] [PubMed] [Google Scholar]
- 12.Taegtmeyer H. Cardiac metabolism as a target for the treatment of heart failure. Circulation. 2004;110:894–6. doi: 10.1161/01.CIR.0000139340.88769.D5. [DOI] [PubMed] [Google Scholar]
- 13.Gopal DM, Sam F. New and emerging biomarkers in left ventricular systolic dysfunction–insight into dilated cardiomyopathy. J Cardiovasc Transl Res. 2013;6:516–27. doi: 10.1007/s12265-013-9462-3. [DOI] [PMC free article] [PubMed] [Google Scholar]
- 14.Bazil JN, Vinnakota KC, Beard DA. Catalytic Coupling of Oxidative Phosphorylation, ATP Demand, and Mitochondrial Reactive Oxygen Species Generation. Biophys J. 2016 doi: 10.1016/j.bpj.2015.09.036. In press. [DOI] [PMC free article] [PubMed] [Google Scholar]
- 15.Tewari SG, Bugenhagen SM, Palmer BM, Beard DA. Dynamics of cross-bridge cycling, ATP hydrolysis, force generation, and deformation in cardiac muscle. J Mol Cell Cardiol. 2015 doi: 10.1016/j.yjmcc.2015.02.006. [DOI] [PMC free article] [PubMed] [Google Scholar]
- 16.Lumens J, Delhaas T, Kirn B, Arts T. Three-wall segment (TriSeg) model describing mechanics and hemodynamics of ventricular interaction. Annals of biomedical engineering. 2009;37:2234–55. doi: 10.1007/s10439-009-9774-2. [DOI] [PMC free article] [PubMed] [Google Scholar]
- 17.Shen YT, Malik FI, Zhao X, Depre C, Dhar SK, Abarzua P, et al. Improvement of cardiac function by a cardiac Myosin activator in conscious dogs with systolic heart failure. Circ Heart Fail. 2010;3:522–7. doi: 10.1161/CIRCHEARTFAILURE.109.930321. [DOI] [PubMed] [Google Scholar]
- 18.Bakkehaug JP, Kildal AB, Engstad ET, Boardman N, Naesheim T, Ronning L, et al. The Myosin Activator Omecamtiv Mecarbil Increases Myocardial Oxygen Consumption and Impairs Cardiac Efficiency Mediated by Resting Myosin ATPase Activity. Circ Heart Fail. 2015 doi: 10.1161/CIRCHEARTFAILURE.114.002152. [DOI] [PubMed] [Google Scholar]
- 19.Janssen PM, Stull LB, Marban E. Myofilament properties comprise the rate-limiting step for cardiac relaxation at body temperature in the rat. American journal of physiology Heart and circulatory physiology. 2002;282:H499–507. doi: 10.1152/ajpheart.00595.2001. [DOI] [PubMed] [Google Scholar]
- 20.Milani-Nejad N, Xu Y, Davis JP, Campbell KS, Janssen PM. Effect of muscle length on crossbridge kinetics in intact cardiac trabeculae at body temperature. The Journal of general physiology. 2013;141:133–9. doi: 10.1085/jgp.201210894. [DOI] [PMC free article] [PubMed] [Google Scholar]
- 21.Deten A, Millar H, Zimmer HG. Catheterization of pulmonary artery in rats with an ultraminiature catheter pressure transducer. American journal of physiology Heart and circulatory physiology. 2003;285:H2212–7. doi: 10.1152/ajpheart.00315.2003. [DOI] [PubMed] [Google Scholar]
- 22.Rey M, Weber EW, Hess PD. Simultaneous pulmonary and systemic blood pressure and ECG Interval measurement in conscious, freely moving rats. Journal of the American Association for Laboratory Animal Science: JAALAS. 2012;51:231–8. [PMC free article] [PubMed] [Google Scholar]
- 23.Ross B, McIntosh M, Rodaros D, Hebert TE, Rohlicek CV. Systemic arterial pressure at maturity in rats following chronic hypoxia in early life. American journal of hypertension. 2010;23:1228–33. doi: 10.1038/ajh.2010.160. [DOI] [PubMed] [Google Scholar]
- 24.Weizsacker HW. Passive elastic properties of the rat abdominal vena cava. Pflugers Archiv: European journal of physiology. 1988;412:147–54. doi: 10.1007/BF00583744. [DOI] [PubMed] [Google Scholar]
- 25.Pacher P, Nagayama T, Mukhopadhyay P, Batkai S, Kass DA. Measurement of cardiac function using pressure-volume conductance catheter technique in mice and rats. Nature protocols. 2008;3:1422–34. doi: 10.1038/nprot.2008.138. [DOI] [PMC free article] [PubMed] [Google Scholar]
- 26.Rice JJ, Wang F, Bers DM, de Tombe PP. Approximate model of cooperative activation and crossbridge cycling in cardiac muscle using ordinary differential equations. Biophysical journal. 2008;95:2368–90. doi: 10.1529/biophysj.107.119487. [DOI] [PMC free article] [PubMed] [Google Scholar]
- 27.Gordon AM, Huxley AF, Julian FJ. The variation in isometric tension with sarcomere length in vertebrate muscle fibres. The Journal of physiology. 1966;184:170–92. doi: 10.1113/jphysiol.1966.sp007909. [DOI] [PMC free article] [PubMed] [Google Scholar]
- 28.Niederer S, Hunter P, Smith N. A quantitative analysis of cardiac myocyte relaxation: a simulation study. Biophysical journal. 2006;90:1697–722. doi: 10.1529/biophysj.105.069534. [DOI] [PMC free article] [PubMed] [Google Scholar]
- 29.Lee HB, Blaufox MD. Blood volume in the rat. J Nucl Med. 1985;26:72–6. [PubMed] [Google Scholar]
- 30.Rey M, Weber EW, Hess PD. Simultaneous pulmonary and systemic blood pressure and ECG Interval measurement in conscious, freely moving rats. Journal of the American Association for Laboratory Animal Science: JAALAS. 2012;51:231. [PMC free article] [PubMed] [Google Scholar]
- 31.Ross B, McIntosh M, Rodaros D, Hébert TE, Rohlicek CV. Systemic arterial pressure at maturity in rats following chronic hypoxia in early life. American journal of hypertension. 2010;23:1228–33. doi: 10.1038/ajh.2010.160. [DOI] [PubMed] [Google Scholar]
- 32.Barclay CJ, Woledge RC, Curtin NA. Inferring crossbridge properties from skeletal muscle energetics. Prog Biophys Mol Biol. 2010;102:53–71. doi: 10.1016/j.pbiomolbio.2009.10.003. [DOI] [PubMed] [Google Scholar]
- 33.Malik FI, Hartman JJ, Elias KA, Morgan BP, Rodriguez H, Brejc K, et al. Cardiac myosin activation: a potential therapeutic approach for systolic heart failure. Science. 2011;331:1439–43. doi: 10.1126/science.1200113. [DOI] [PMC free article] [PubMed] [Google Scholar]
- 34.Malik FI, Hartman JJ, Elias KA, Morgan BP, Rodriguez H, Brejc K, et al. Cardiac myosin activation: a potential therapeutic approach for systolic heart failure. Science. 2011;331:1439–43. doi: 10.1126/science.1200113. [DOI] [PMC free article] [PubMed] [Google Scholar]
- 35.Janssen PM. Kinetics of cardiac muscle contraction and relaxation are linked and determined by properties of the cardiac sarcomere. American journal of physiology Heart and circulatory physiology. 2010;299:H1092–9. doi: 10.1152/ajpheart.00417.2010. [DOI] [PMC free article] [PubMed] [Google Scholar]
- 36.de Tombe PP, Mateja RD, Tachampa K, Ait Mou Y, Farman GP, Irving TC. Myofilament length dependent activation. Journal of molecular and cellular cardiology. 2010;48:851–8. doi: 10.1016/j.yjmcc.2009.12.017. [DOI] [PMC free article] [PubMed] [Google Scholar]
- 37.Ventura-Clapier R, Garnier A, Veksler V. Energy metabolism in heart failure. The Journal of physiology. 2004;555:1–13. doi: 10.1113/jphysiol.2003.055095. [DOI] [PMC free article] [PubMed] [Google Scholar]
- 38.Shearer F, Lang C, Struthers AD. Renin–angiotensin–aldosterone system inhibitors in heart failure. Clinical Pharmacology & Therapeutics. 2013;94:459–67. doi: 10.1038/clpt.2013.135. [DOI] [PubMed] [Google Scholar]
- 39.Cleland JG, Teerlink JR, Senior R, Nifontov EM, McMurray JJ, Lang CC, et al. The effects of the cardiac myosin activator, omecamtiv mecarbil, on cardiac function in systolic heart failure: a double-blind, placebo-controlled, crossover, dose-ranging phase 2 trial. The Lancet. 2011;378:676–83. doi: 10.1016/S0140-6736(11)61126-4. [DOI] [PubMed] [Google Scholar]
- 40.Allen DG, Kentish JC. Calcium concentration in the myoplasm of skinned ferret ventricular muscle following changes in muscle length. The Journal of physiology. 1988;407:489–503. doi: 10.1113/jphysiol.1988.sp017427. [DOI] [PMC free article] [PubMed] [Google Scholar]
- 41.Allen DG, Kurihara S. The effects of muscle length on intracellular calcium transients in mammalian cardiac muscle. The Journal of physiology. 1982;327:79–94. doi: 10.1113/jphysiol.1982.sp014221. [DOI] [PMC free article] [PubMed] [Google Scholar]
- 42.Segel IH. Enzyme kinetics. Wiley; New York: 1975. [Google Scholar]
- 43.Tewari SG, Bugenhagen SM, Wang Z, Schreier DA, Carlson BE, Chesler NC, et al. Analysis of cardiovascular dynamics in pulmonary hypertensive C57BL6/J mice. Front Physiol. 2013;4:355. doi: 10.3389/fphys.2013.00355. [DOI] [PMC free article] [PubMed] [Google Scholar]
- 44.Dobesh DP, Konhilas JP, de Tombe PP. Cooperative activation in cardiac muscle: impact of sarcomere length. American journal of physiology Heart and circulatory physiology. 2002;282:H1055–62. doi: 10.1152/ajpheart.00667.2001. [DOI] [PubMed] [Google Scholar]
- 45.Ebus J, Papp Z, Zaremba R, Stienen G. Effects of MgATP on ATP utilization and force under normal and simulated ischaemic conditions in rat cardiac trabeculae. Pflügers Archiv. 2001;443:102–11. doi: 10.1007/s004240100667. [DOI] [PubMed] [Google Scholar]
- 46.Lu Z, Moss RL, Walker JW. Tension transients initiated by photogeneration of MgADP in skinned skeletal muscle fibers. The Journal of general physiology. 1993;101:867–88. doi: 10.1085/jgp.101.6.867. [DOI] [PMC free article] [PubMed] [Google Scholar]
- 47.De Tombe PP, Stienen G. Impact of temperature on cross-bridge cycling kinetics in rat myocardium. The Journal of physiology. 2007;584:591–600. doi: 10.1113/jphysiol.2007.138693. [DOI] [PMC free article] [PubMed] [Google Scholar]
- 48.McDonald KS, Wolff MR, Moss RL. Sarcomere length dependence of the rate of tension redevelopment and submaximal tension in rat and rabbit skinned skeletal muscle fibres. The Journal of Physiology. 1997;501:607–21. doi: 10.1111/j.1469-7793.1997.607bm.x. [DOI] [PMC free article] [PubMed] [Google Scholar]


