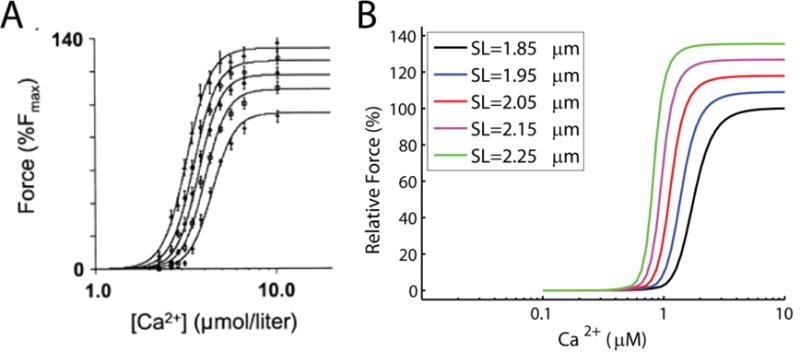
Figure E.1.

Force calcium length experiments and model simulations. (A) Force-calcium-length experiments from skinned rat cardiac muscle (figure reproduced from Dobesh et al. [44], pending permission). (B) simulations of the experiments using identified myofilament model. Experiments were done at sarcomere lengths of 1.85, 1.95, 2.05, 2.15 and 2.25 μm. Force responses are reported with respect to the maximum force obtained at sarcomere length of 1.85 μm. Model simulations are done with ATP = 5mM, ADP = 0mM, and Pi = 0mM.
