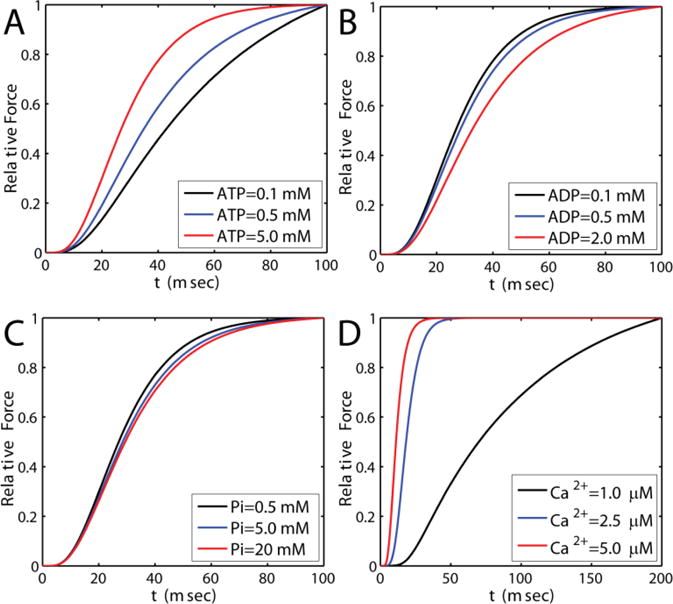
Figure G.1.

Model simulations capturing the effect of ATP, ADP and Pi on rate of force development. A. ADP = 0mM, Pi = 0mM. ATP is as shown in the legend. B. ATP = 5mM, Pi = 0mM. ADP is as shown in the legend. C. ATP = 5mM, ADP = 0mM, and Pi is as shown in the legend. Temperature is 20 °C and Ca2+ is 15 μM. D. ATP = 5mM, ADP = 0 mM, Pi = 0mM and Ca2+ as shown in the legend. Temperature is 20 C.
