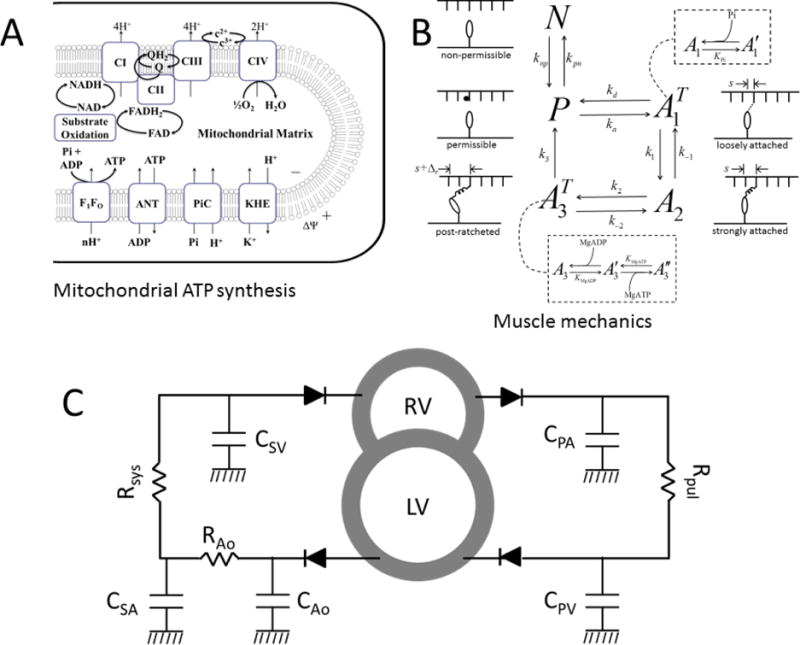
Figure 1.

Schematics showing mechanoenergetics coupling and whole-body cardiovascular system. A. Model of oxidative phosphorylation used to compute metabolite concentration from basal ATP hydrolysis rate under normal and failing-heart conditions. B. Schematics of the cross-bridge kinetic model. The state N is a non-permissible XB state where myosin heads cannot bind with actin (as in the absence of cytosolic Ca2+), while P is a permissible XB state during which myosin heads can bind with actin molecules. The transition from state N to P depends on thick-thin filament overlap and Ca2+ concentration. The states and A2 represent loosely and strongly bound cross-bridge attached state; is the strongly bound (post-ratcheted or post-powerstroke) state. C. Schematics of the CVS model used to simulate Frank-Starling curves. Diodes represent inlet/outlet valves and ensure one-way blood flow. CPA, CPV, CSA, CAo and CSV represent lumped compliances of pulmonary artery, pulmonary vein, systemic artery and systemic vein. Rpul, Rsys and RAo represent vascular resistances. RV and LV represent right and left ventricular cavities.
