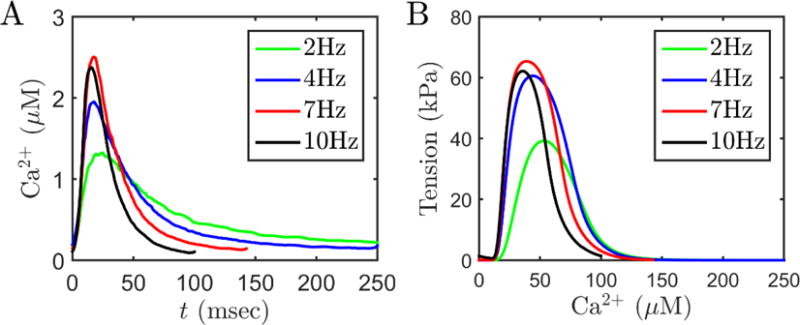
Figure 2.

Calcium and tension transients in rat cardiac muscle. A. Representative time courses of Ca2+ data used to drive the myofilament model. Frequency dependent acceleration of relaxation is clearly visible. Data are from Janssen et al. [19]. B. Model simulated tension transients were used to compute TTP, RT50 and Tdev. For these simulations, SL is fixed at 2.2 μm, temperature is 37.5 °C and metabolite concentrations are: MgATP = 8 mM; MgADP = 18 μM; Pi = 0.6 mM (representative of resting level metabolites concentrations under physiological conditions).
