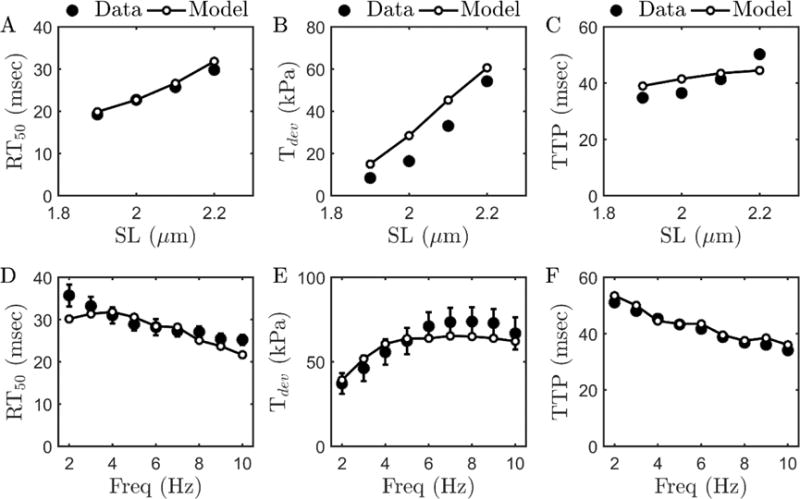
Figure 3.

Model fits to force-frequency-length data [19] from rat cardiac muscle obtained at 37.5 °C using the myofilament model. (A, B, C) show RT50, Tdev, and TTP data obtained at four different muscle lengths corresponding to SL’s of 1.9, 2.0, 2.1 and 2.2 μm. Stimulation frequency for these experiments was 4Hz. (D, E, F) RT50, Tdev, and TTP data obtained at optimal length (corresponding to SL of 2.2 μm) with different stimulation frequencies (2–10Hz). Metabolite concentrations are fixed to the physiological concentration as in Figure 2. Error bars shown in (D) and (E) represent standard error from the n=9 dataset [19].
