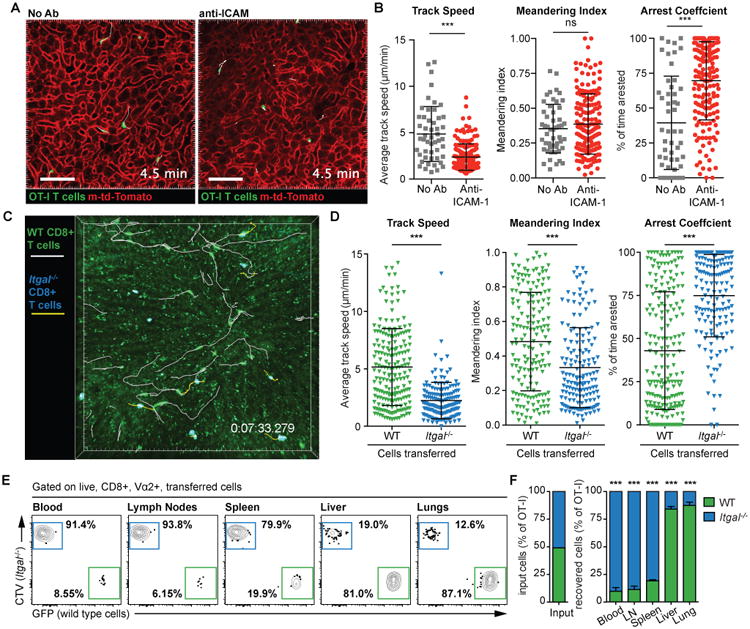
Fig 1. LFA-1:ICAM-1 interactions are required for CD8+ T cell motility in the liver.

(A) 2. hours prior to the transfer of 7 × 10⁶ in vitro activated OT-I T cells, mice (WT or mT/mG) were treated with blocking Abs to ICAM-1. 4 hours after cell transfer mice were prepared for intravital imaging and imaged by 2-photon microscopy using a standard galvanometer-scanner to acquire a 50-micron deep Z-stack approximately every 30 seconds. Representative images from time lapse imaging of mT/mG mice either with or without anti-ICAM-1 are shown. Scale bar is 30 μm. (B) Movement parameters of OT-I cells following anti-ICAM-1 treatment; data pooled from 4 experiments and analyzed using linear mixed models with experiment and mouse as random effects and speed, meandering index or arrest as the fixed effects. Means and standard deviations (SD) are shown. (C) 7 × 10⁶ in vitro activated Itgal-/- OT-I T cells (labeled with cell trace violet) and 7 × 10⁶ in vitro activated GFP+ WT OT-I+ T cells were co-transferred to WT recipient mice. Mice were imaged as in (A); image shows a representative frame from a time-lapse movie showing tracks of the Itgal -/- (yellow) and WT T cells (white); scale bar is 50 μm. (D) Movement parameters of Itgal -/- and WT cells in the livers of naive recipient mice as described in C; data are pooled from 3 mice in 2 independent experiments and analyzed as in (B). (E) 2 × 10⁶ in vitro activated Itgal -/- OT-I CD8+ T cells (labeled with cell trace violet) and 2 × 10⁶ in vitro activated GFP+ WT OT-I CD8+ T cells were co-transferred to WT recipient mice. 24 hours later the blood, lymph nodes, spleen, liver and lungs were harvested and the proportion of WT and Itgal-/- cells in each organ determined by flow cytometry (representative plots all from the same mouse shown). (F) Summary data for the proportions of WT and Itgal -/- cells in organs harvested from 5 mice in one of two similar independent experiments, analyzed by one sample t-test (compared to the input proportions of WT and Itgal -/- cells). Means and SD are presented.
