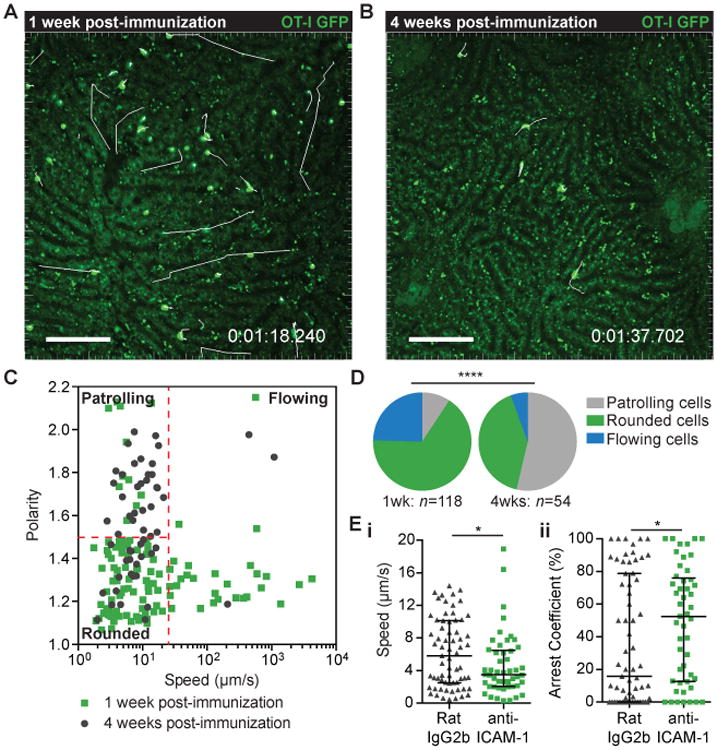
Fig 3. Memory CD8+ T cells display patrolling behavior in the liver.

2 × 10⁴ GFP+ OT-I cells were transferred to C57BL/6 mice prior to immunization with 5 × 10⁴ P.berghei CS5M sporozoites. 1 week (A) and 4 weeks (B) post-immunization mice were prepared for intra-vital imaging and the livers imaged by 2-photon microscopy using a resonant scanner to collect time-lapse moves of a single Z-slice at ∼3 frames/second; images are representative time-points with T cell tracks shown in white; scale bar is 50 μm. (C) Mean speed vs. polarity of T cells in the liver, 1 week (green points) and 4 weeks (grey points) post-immunization. (D) Proportion of cells exhibiting different T cell migration behaviors 1 week and 4 weeks post immunization, analysis was performed by a χ2 test. (E) (i) mean speed and (ii) arrest coefficients of OT-I GFP T cells in the liver 4 weeks post immunization (analysis based on 50um Z stacks at 1 frame/30secs). Mice received 50 μg anti-ICAM or isotype control antibodies 3 hours before imaging. Analysis was performed by one-tailed Mann-Whitney U test as the direction of the expected effect was already known from previous experiments. Data are pooled from 6 mice in each experimental group; medians and interquartile ranges are presented.
