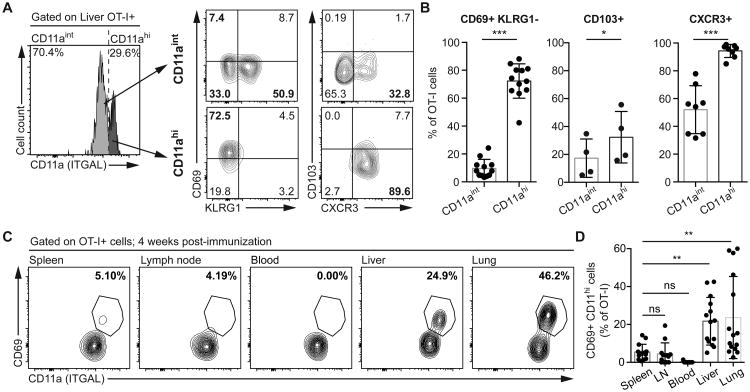
Fig 5. CD11ahi memory CD8+ T cells in the liver have a TRM phenotype.
2 × 10⁴ CD45.1+ naïve OT-I cells were transferred to C57BL/6 mice prior to immunization with 5 × 10⁴ P.berghei CS5M sporozoites. (A) Representative flow cytometry plots of the expression of CD69, KLRG1, CD103 and CXCR3 by CD45.1+ CD8+ OT-I T cells expressing intermediate and high levels of ITGAL (CD11aint and CD11ahi) in the liver 4 weeks post-immunization. (B) Summary plots showing the proportion of cells expressing the indicated phenotypes 4 weeks post-immunization in the liver. Data are pooled from 4 independent experiments for CD69 and KLRG1, a single experiment for CD103 and 2 independent experiments for CXCR3; data were analyzed by linear mixed models including mouse as a random effect and CD11a subset as a fixed effect. Bars show means and SD. (C) Representative flow cytometry plots showing the co-expression of CD69 and CD11a in the indicated organs (from a single animal) 4 weeks post-immunization. (D) Summary of the proportion of OT-I cells in the indicated organs that are CD11ahi CD69+. Data are pooled from 3 independent experiments and analyzed using a linear mixed model including mouse as a random effect and the organ as the fixed effect. Bars show means and SD.

