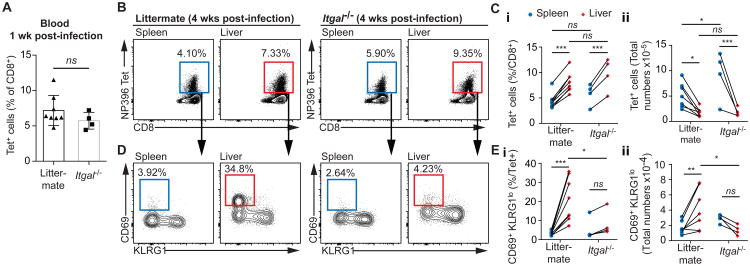
Fig 7. Itgal-/- mice do not form liver TRMs following LCMV infection.
Itgal-/- and littermate mice were infected with 2 × 10⁵ pfu/mouse LCMV Armstrong. (A) 1 week post-infection the % of CD8+ T cells in the blood that was NP396-specific was measured by flow cytometry; data are mean and SD analyzed using a 2-tailed students t-test. 4 weeks post-infection the NP396 specific immune response was measured in the spleen and liver by flow cytometry, with (B) representative flow cytometry plots from individual mice and (C) summary data presented. We further determined the proportion of antigen specific cells that had the TRM phenotype (CD69+ KLRG1lo) by flow cytometry for each organ and genotype, with (D) representative flow cytometry plots from individual mice and (E) summary data presented. Data in B-E were analyzed using linear mixed models including mouse as a random effect and organ and genotype and fixed effects; pairwise p values derived from the models are given.

