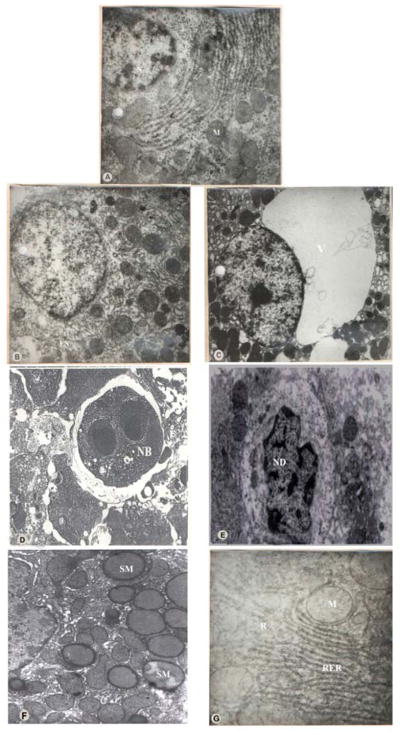
Figure 7.
Transmission Electron Microscope (TEM)
A: TEM of the liver of Control Rat.
B: TEM of the liver of Al2O3-30nm treated rats showing Focal necrosis.
C: TEM of the liver of Al2O3-30nm treated rats showing Extensive cytoplasmic vacuolization.
D: TEM of the liver of Al2O3-30nm treated rats showing a Necrotic body with dense deposits.
E:TEM of the liver of Al2O3-30nm treated rats showing Nucleolar degeneration.
F:TEM of the liver of Al2O3-40nm treated rats showing swollen Mitochondria.
G: TEM of the liver of Al2O3-40nm treated rats showing disrupted RER with increase in number of Ribosomes.
N: Nucleus; M: Mitochondria; FN: Focal Necrosis; V: Vacuolization;
NB: Necrotic Body; ND: Nucleolar Degeneration; SM: Swollen Mitochondria;
R: Ribosomes; RER: Rough Endoplasmic Reticulum

