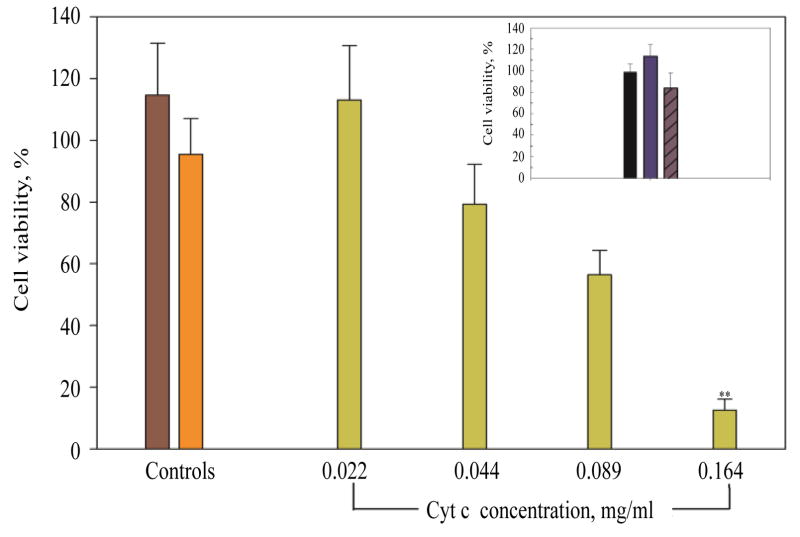
Figure 7.
Dose response curve of Cyt c-HA NPs on A549 cells. Cyt c-HA NPs cytotoxicity was measured after 6 h of incubation in A549 cells (green bars) and COS-7 cells (insert). Negative controls were also tested in both cell lines: A549 cells (HA=brown bar, Native Cyt c=orange bar) and COS-7 cells (HA=black bar, Native Cyt c=blue bar, and Cyt c-HA NPs=purple with diagonal lines bar). Asterisks (**p<0.001) represent the significant statistical difference between Cyt c-HA NPs incubated in A549 cells and in COS-7 cells.

