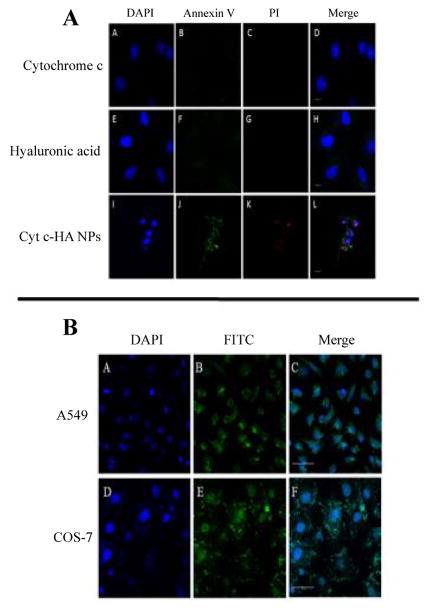
Figure 8.
Confocal microscopy images after sample incubation. (A) Apoptosis induction after sample incubation in A549 cells. Cyt c (top row) shows no apoptosis induction similar to HA (middle row) while Cyt c-HA NPs show significant early (Annexin V=green dye) and late (PI=red dye) apoptosis induction. Cells were observed under a 40× objective. Bar scale represents 10 μm. (B) Cyt c-HA NPs-FITC cellular uptake visualized in A549 and COS-7 cells. Negative (COS-7) and positive (A549) CD44 cells were incubated with the NPs to observe preferential internalization. A549 cells (top row) show sample internalization (green fluorescence) while COS-7 cells (bottom row) display sample accumulation around the cells but no fluorescence inside the cell. DAPI (blue dye) was used to stain cell nuclei. Cells were observed under a 20× objective. Bar scale represents 50 μm.

