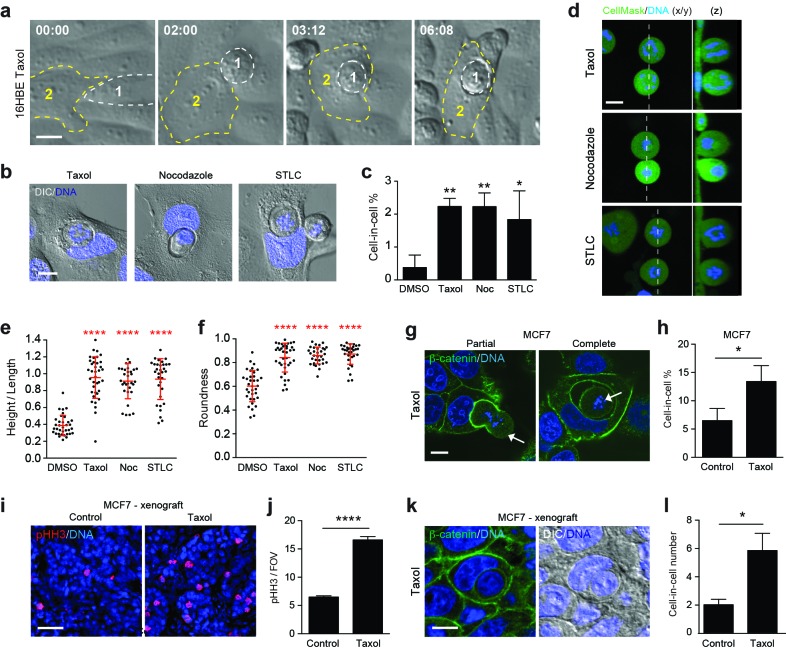
Figure 7. Paclitaxel/taxol treatment promotes mitotic deadhesion, rounding and entosis.
(a) Representative timelapse images of adherent 16HBE cells treated with 1 μM taxol. Cell 1 (outlined white) rounds up in prometaphase and subsequently penetrates an adherent interphase neighbour (Cell 2, outlined yellow). Timestamps are shown (hr:min) and scale bar = 10 μm. (b) Representative confocal/DIC images of adherent cell-in-cell structures in 16HBE treated with taxol (1 μM), nocodazole (100 ng/ml) or STLC (20 μM) for 24 hr. Cells were stained for DNA (blue), scale bar = 10 μm. (c) Quantification of drug-induced cell-in-cell formation. >150 cells were counted per sample/experiment, across three separate experiments. Error bars denote mean±SEM. **p<0.002; *p<0.02, t-test. (d) Mitotic morphology of 16HBE cells treated with taxol (1 μM), nocodazole (100 ng/ml) or STLC (20 μM) for 24 hr. Live cells were stained for cell body (green) and DNA (blue). Midplane x/y, and z sections through the dashed line, are presented. Scale bar = 10 μm. Quantification of (e) mitotic spreading (cell height/length) and (f) mitotic rounding (where 1 = a perfect circle) in control and drug-treated cells. >15 cells were counted per sample/experiment, across three separate experiments. Error bars denote mean±SD. ****p<0.0001, Mann-Whitney U test. (g) Representative confocal images of partially and completely formed cell-in-cell structures in MCF7 cells treated with taxol (1 μM), and stained for β-catenin (green) and DNA (blue). The arrowheads point to prometaphase arrested cells internalised by adherent, interphase neighbours. Scale bar = 10 μm. (h) Quantification of taxol-induced entosis in MCF7. >150 cells were counted per sample/experiment, across three separate experiments. Error bars denote mean±SEM. *p<0.04, t- test. (i) Confocal images of MCF7 xenografts treated −/+ taxol for 24 hr and stained for phospho-Histone H3 (pHH3, red) and DNA (blue). Scale bar = 50 μm. (j) Quantification of pHH3-positive, mitotic cells in MCF7 mouse xenografts treated −/+ taxol for 24 hr. ****p<0.0001, t-test. (k) Representative confocal and DIC images of an entotic cell-in-cell structure in a taxol-treated MCF7 xenograft, stained for β-catenin (green) and DNA (blue). Scale bar = 10 μm. (l) Quantification of cell-in-cell formation in MCF7 mouse xenografts treated −/+ taxol for 24 hr. *p<0.01, t-test.
DOI: http://dx.doi.org/10.7554/eLife.27134.025

