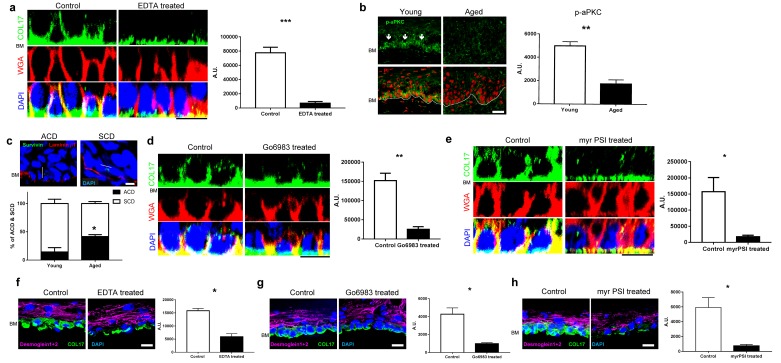
Figure 5. COL17 distribution is modulated by aPKC.
(a) COL17 staining of whole IFE skin treated with 5 mM EDTA. The quantitative fluorescent intensity of COL17 in basal cells of IFE from control (PBS) and 5 mM EDTA treated (n = 4). Mann-Whitney test. Samples were taken from young adult WT mice at 6–10 weeks. Scale bar: 20 μm. (b) Phospho-aPKC labeling (indicated with arrows) and quantitative fluorescent intensity results from young and aged WT IFE skin (n = 4). Mann-Whitney test. Scale bar: 20 μm.(c) Representative figures of asymmetric cell division (ACD; scored as perpendicular to basement membrane) and symmetric cell division (SCD; in parallel to basement membrane) in young IFE. Survivin staining indicates the direction of the cell division. Laminin β1 signifies basement membrane. Scale bar: 10 μm. Graph of percentage of ACD and SCD in young and aged IFE (n = 4). Student’s t-test. (d–e) The pharmacological inhibition of pan-aPKC (d, 1 μM of Go6983; 0.00002% DMSO as control) and aPKCλ/ζ (e, 10 μM of myr PSI; water as control) in whole IFE skin from young adult WT mice, followed by COL17 staining. The quantitative fluorescent intensity of COL17 in lateral membrane of basal cells from control and 1 μM Go6983 treated (d) and 1 μM myr PSI (e) (n = 4). Mann-Whitney test. Scale bar: 10 μm. BM, basement membrane. (f–h) EDTA treatment (5 mM; PBS as control, f) and pharmacological inhibition of pan-aPKC (g, 1 μM of Go6983; 0.00002% DMSO as control) and aPKCλ/ζ (h, 10 μM of myr PSI; water as control) on 3D epidermis. The relative fluorescent intensity of COL17 in lateral membrane of basal cells was measured (n = 4). Mann-Whitney test. BM, basement membrane. Scale bar: 20 μm. The data are the means ± SE. *0.01<p<0.05, **0.001<p<0.01, ***0.0001<p<0.001.

