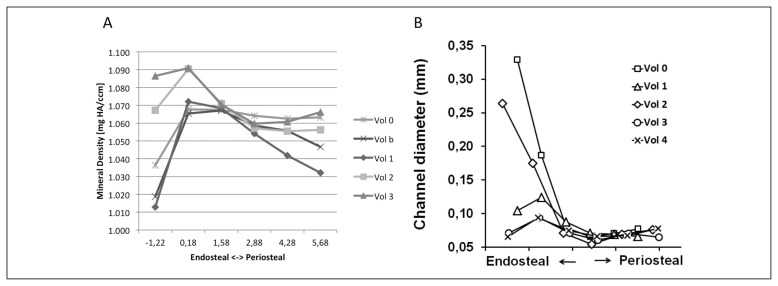
Figure 3.
A) Quantification of volumetric Bone Mineral Density in the 30 subregions defined within the biopsy. B) Quantification of Haversian canal diameter in the 30 subregions of the biopsy. The fracture runs through vol0, vol1 and vol2, while vol3 and vol4 are situated further away from the fracture. Points on the left hand side of the graph are situated in their respective volumes near the endosteal surface of the biopsy, while points on the right hand of the graph are situated near the periosteal side of the biopsy.

