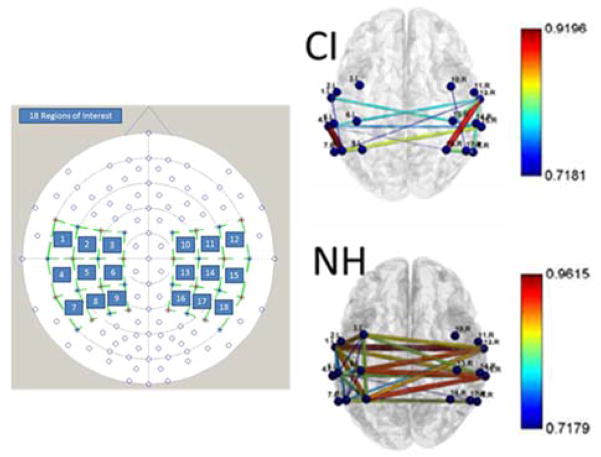
Figure 2.
Example data showing resting state connectivity. The left panel shows the montage used and the 18 regions of interest. The right panels show the connectivity maps: the line colour and thickness denote the strength of connectivity (r) in the different brain regions of interest (colour bar denotes r-values). The data clearly show a lack of inter-hemispheric connectivity in the CI user compared to the NH listener.

