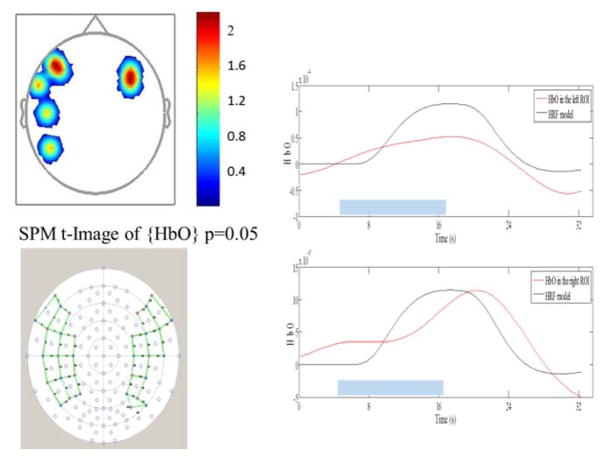
Figure 3.
Left panels show the montage of optodes used in Experiment 2 and the activation pattern elicited in one NH listener when watching visual spondees. The colour bar shows the t-values. The right panels show the average bilateral haemodynamic response functions from the regions of greatest activation in each hemisphere. The blue blocks indicate ‘stimulus-on’ times.

