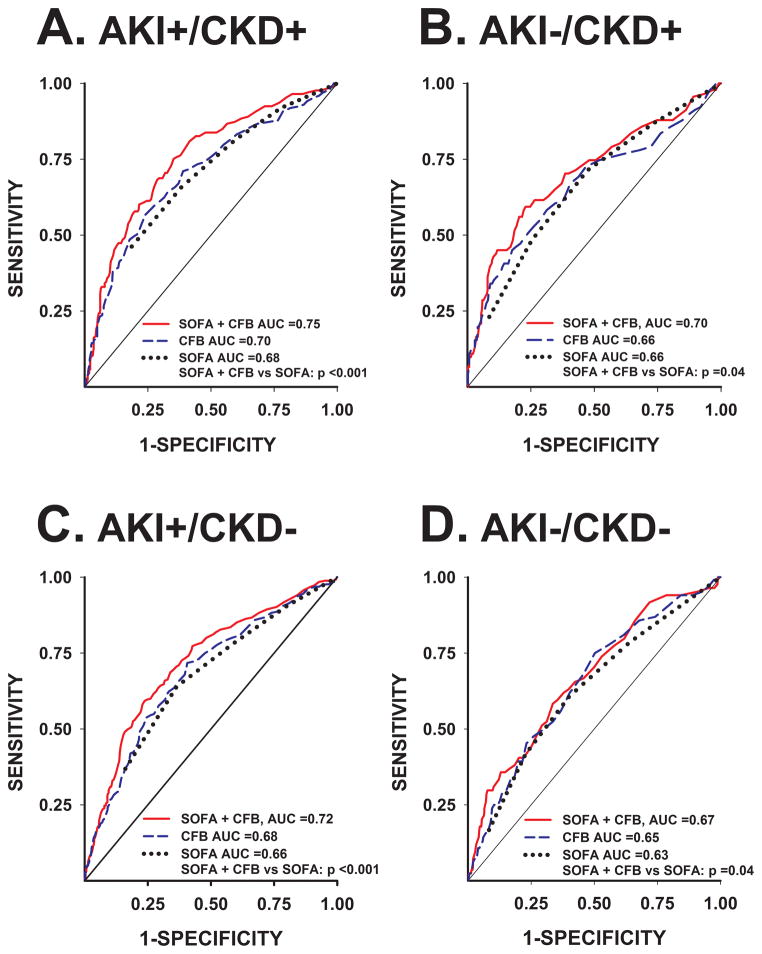
Figure 3.
Receiver-Operating Characteristic plots representing the area under the curve (AUC) for the prediction of hospital mortality by the model of admission SOFA score + CFB at 72 h (red), CFB at 72 h (blue), and SOFA score (black). Comparison P-values of SOFA + CFB vs SOFA alone for each AKI/CKD subgroup were calculated. AKI =occurrence of acute kidney injury; CFB =cumulative fluid balance; CKD =pre-existing chronic kidney disease; SOFA =Sequential Organ Failure Assessment score

