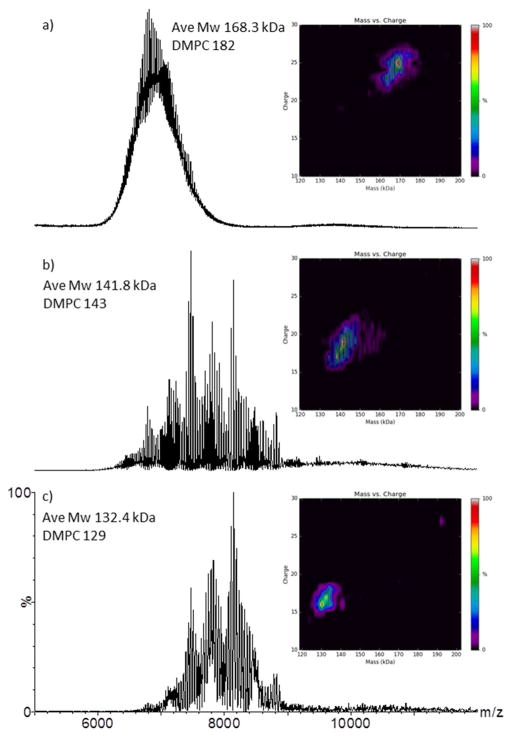
Figure 2.
Representative native-MS spectra acquired under optimized instrument conditions for the empty MSP1D1-Nd acquired on the on the: a) Q-ToF (source temperature 30°C, sample cone 150V, TWIG trap 10V); b) Orbitrap (capillary temperature 200°C, source induced dissociation 80V, HCD 20V); c) FT-ICR (capillary temperature 100°C, skimmer 100V, collision cell 4V). The insets are heat-maps displaying the zero-charge deconvoluted molecular weight along the x-axis and the observable charge states which are present in the unprocessed data, on the y-axis. All spectral data are unprocessed apart from spectrum a, where a minimal smooth was applied (10×2 Savitsky-Golay, MassLynx 4.1). The empty MSP1D1-Nd average molecular weight (Mw in kDa) and average phospholipid (DMPC) count are noted.

