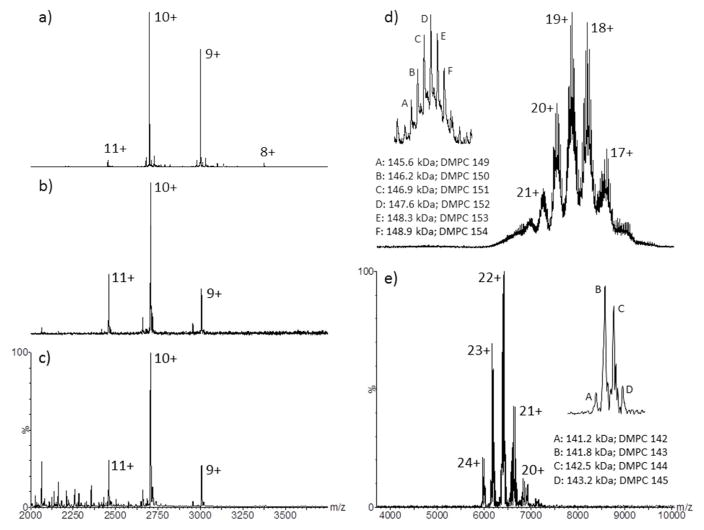
Figure 3.
Q-ToF tandem-MS (m/z 3500) of a) bacteriorhodopsin M60A-OG micelle followed by collision cell activation (sample cone 25 V, TWIG trap SF6 70 V); b) FT-ICR quadrupole tandem-MS selection (m/z 3500; skimmer 25 V) of bacteriorhodopsin (B-0184) followed by continuous IRMPD activation for 1 s at 70% power; c) continuous IRMPD activation of the entire m/z range (m/z 1000–6000; skimmer 25 V) for 0.5 s at 75% power; d) Q-ToF quadrupole tandem-MS selection (m/z 6500; sample cone 50 V) and collision cell activation (TWIG trap SF6 40 V) and e) FT-ICR quadrupole tandem-MS selection (m/z 6000; skimmer 50 V) and continuous IRMPD activation (0.2 s, 50% power) of the empty MSP1D1-Nd. Individual charge states are annotated on all spectra. Insets (d & e) display the “zoomed-in” regions of the MSP1D1-Nd z = 18+ charge state (Q-ToF) and z = 23+ charge state (FT-ICR) with annotated fine structure corresponding to the intact molecular weight (kDa) and associated phospholipid (DMPC) number.

