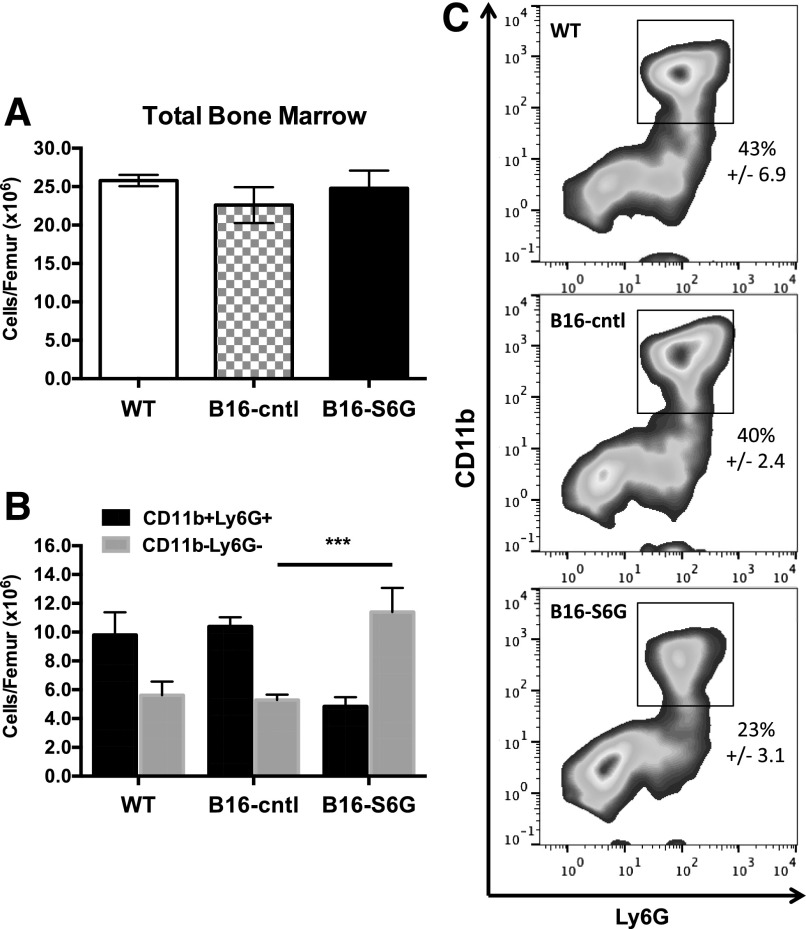
Figure 2. Depleted marrow neutrophil reservoir in B16-S6G mice.
(A) Total marrow cellularity per femur. (B) Total cells per femur found to express PMN surface phenotype (CD11b+Ly6G+) vs. non-PMNs (CD11−Ly6G−) (n = 3). ***P < 0.001. (C) Representative flow cytometry plots depicting the population shift quantified in (B).

