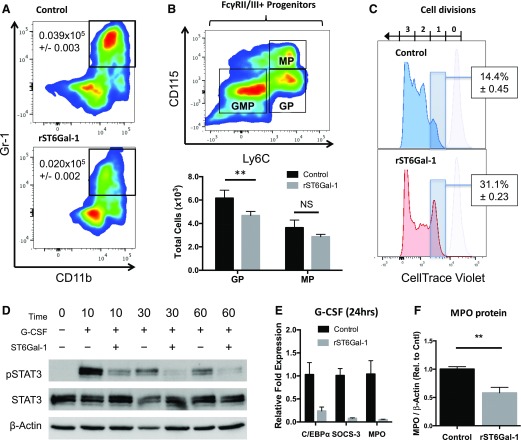
Figure 5. ST6Gal-1 inhibits G-CSF signaling and GP formation.
LK cells enriched from pooled WT marrow were expanded in culture in the presence of murine G-CSF, SCF, and IL-3. ST6Gal-1-treated cells were subjected to 3 h of ex vivo sialylation before expansion. After 4 d, samples were collected and analyzed by flow cytometry for lineage and FcγRII/III+ progenitor surface markers. Proliferation was assessed as a function of CellTrace Violet dye dilution after 7 d in culture. LK cells treated and expanded as above were purified by Gr-1 expression and analyzed by Western blot for MPO content. In a separate experiment, we measured STAT-3 phosphorylation and downstream gene expression in ST6Gal-1-treated and control LK exposed to 100 ng/ml G-CSF. (A) Quantification of total number of CD11bhiGr-1hi neutrophils per milliliter recovered after 4 d in culture (n = 6). P < 0.0001. (B) Representative plot of myeloid progenitor composition, with total GPs and MPs recovered after 4 d in culture. (C) Effects of rST6Gal-1 on cell proliferation. Light purple peaks represent initial intensity of CellTrace Violet staining. Percentages denote proportion of cells that have undergone only 1 cell division (n = 3). P < 0.0001. (D) Representative p-STAT-3 (Tyr705) blot after G-CSF treatment of LK cells. (E) Expression of several genes downstream of the G-CSF pathway was assessed by RT-qPCR analysis relative to β-2 microglobulin after 24 h cytokine treatment. (F) MPO protein content of Gr-1+ cells isolated from 7 d LK culture, normalized to β-actin. Values shown are relative to highest control sample (n = 3). **P < 0.01.

