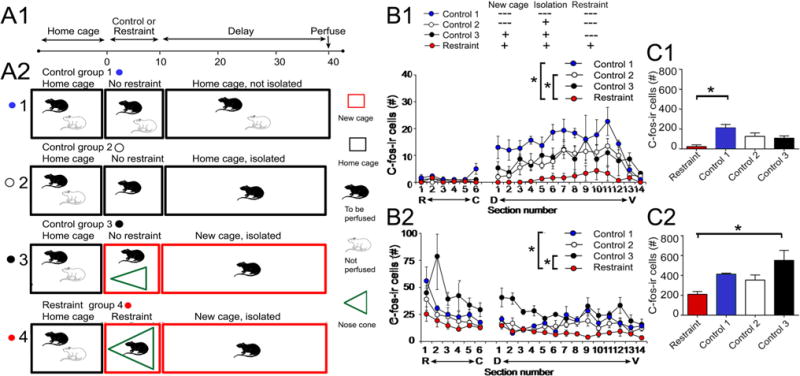
Fig. 2.

Comparison of c-fos-ir in restrained and control rats. a1 Experimental timeline. Animals were brought to the lab in their home cage, and then they were restrained or were controls. Afterwards, there was a delay of 30 min and then animals were perfusion-fixed. 2 Four experimental groups are shown. All groups started with rats initially housed in pairs, brought to the laboratory in their home cage (black box). For control group 1, only one rat of the pair was perfused after 40 min. Control group 2 took one rat out of the home cage when the cage was brought to the lab and the other was perfused 40 min later. Control group 3 took one rat out of the home cage, put it in a new cage, and then perfused it 40 min later. The restrained group took one rat out of the home cage, restrained it in a nose cone (green) for 10 min, and then let it move freely for 30 min, when it was perfused. b1 Mean (±SEM) for hilar c-fos-ir cells is shown for all groups. Sections 1–6 were from the dorsal DG (R rostral, C caudal, as shown in Fig. 1a). Sections from ventral DG were cut horizontally and the most dorsal section is labeled #1. D dorsal, V ventral. Asterisk indicates significant differences by two-way RMANOVA (p < 0.05). The restrained group was significantly different from control groups 1 and 2 by pairwise comparisons (p < 0.05). 2 GCL c-fos-ir cells are plotted for all groups. Differences were significant by two-way RMANOVA (p < 0.05) with the restrained group significantly different from control groups 1 and 3 by paired comparison (p < 0.05). c1 Hilar c-fos-ir is shown for all four experimental groups. All sections from the septotemporal axis were pooled for each rat. One-way ANOVA showed that there were significant differences (p < 0.05). The restrained rats were significantly different from control group 1 (asterisks, p < 0.05). 2 GCL c-fos-ir is plotted for all groups. The restrained rats were significantly different from control group 3 (asterisk, p < 0.05)
