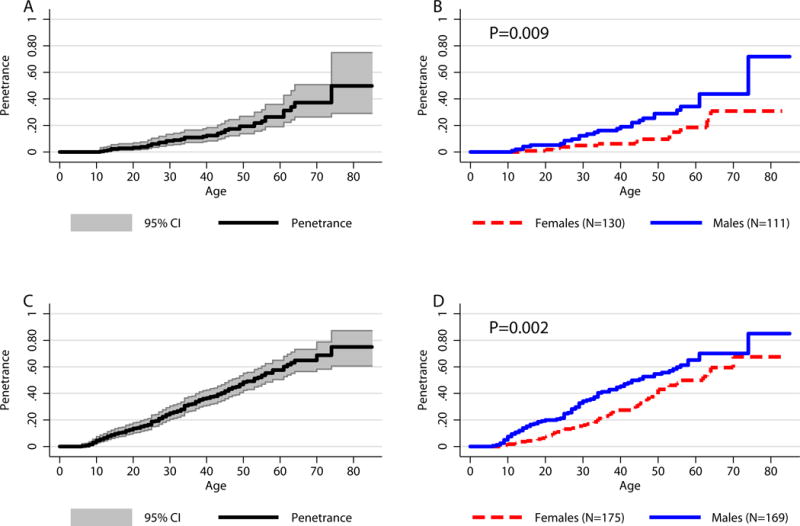
Figure 2. Kaplan-Meier Penetrance Curves.

A) Overall age-related penetrance for the 241 SDHB mutation carriers screened for the disease. B) Age-related penetrance in the 241 SDHB mutation carriers separated by sex. C) Overall age-related penetrance for the 241 SDHB mutation carriers screened for the disease and 103 index patients (N=344). D) Age-related penetrance in the 241 SDHB mutation carriers and 103 index patients (N=344) separated by sex. C) and D) represent penetrance estimates if analysis was not corrected for ascertainment bias.
Upper gray line represents estimated upper bound of the age-related penetrance. Lower gray line represents estimated lower bound of the age-related penetrance.
