
Figure 1. Race by Fat Mass Interactions for the (A) Dietary Restraint, (B) Shape/Weight Overvaluation, and (C) Body Dissatisfaction Subscales of the Three-Factor Structure.
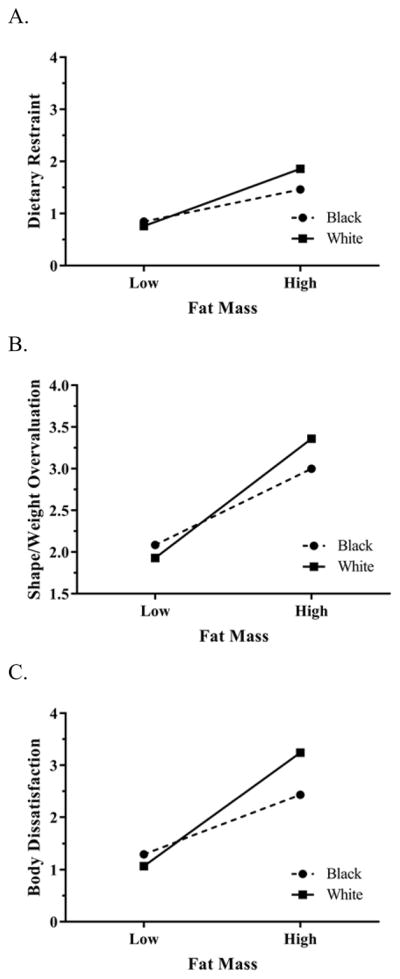
A. There were significant race by fat mass interactions (adjusting for age, sex, and height) for the Dietary Restraint factor of the seven-item, three-factor structure. At lower fat mass, scores were similar for whites and blacks; but at higher fat mass, scores were significantly higher for white youth compared to black youth (p < .05).
B. There were significant race by fat mass interactions (adjusting for age, sex, and height) for the Shape/Weight Overvaluation factor of the seven-item, three-factor structure. At lower fat mass, scores were similar for whites and blacks; but at higher fat mass, scores were significantly higher for white youth compared to black youth (p < .05).
C. There were significant race by fat mass interactions (adjusting for age, sex, and height) for the Body Dissatisfaction factor of the seven-item, three-factor structure. At lower fat mass, scores were similar for whites and blacks; but at higher fat mass, scores were significantly higher for white youth compared to black youth (p < .001).