
Figure 2.
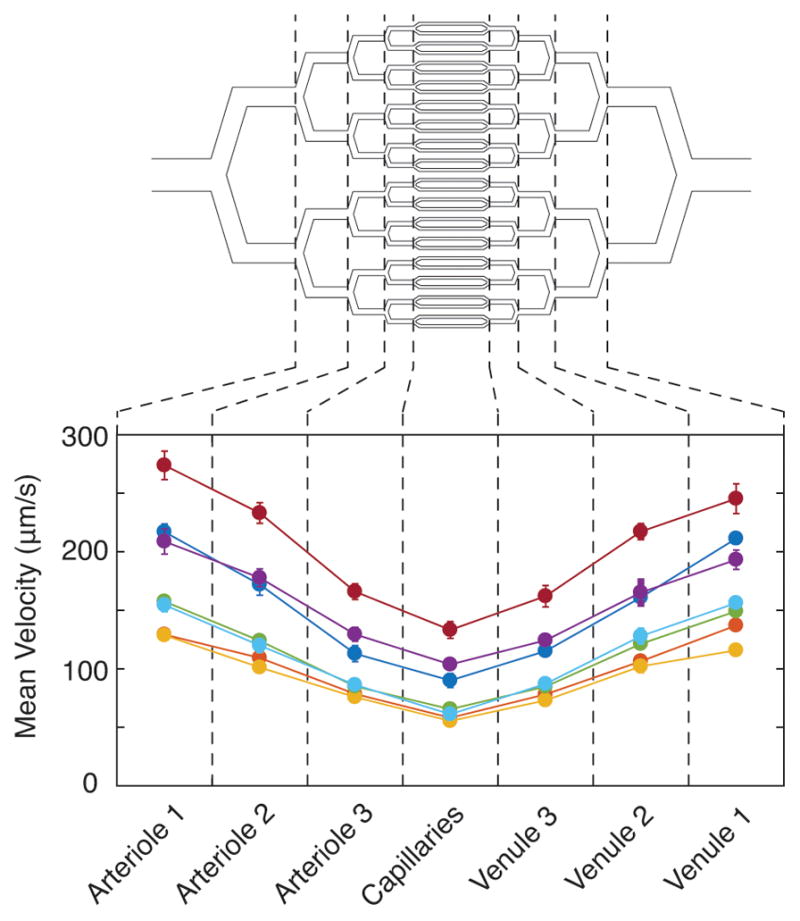
Sickle cell blood velocity across the microvasculature. We measured blood velocity for both sickle (yellow, orange, green, dark blue, light blue, and purple) and healthy (red) patient blood samples in each section of our microvascular channels at atmospheric oxygen tension. Blood velocity for all samples is highest in the largest channels and lowest in the capillaries.