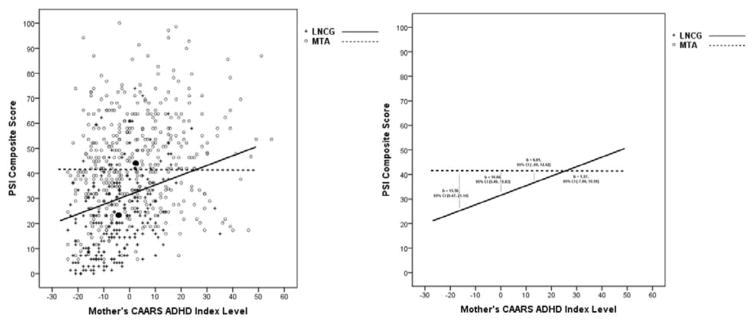
Figure 2.
The relationship between maternal ADHD index level and parenting stress in the MTA and LNCG samples. CAARS ADHD index level was centered on the pooled sample mean (x axis = 0). The convergence of lines suggests that having a child with ADHD or the mother having ADHD herself has similar effects on the level of parenting stress. Estimate intercept differences between groups at different levels of CAARS ADHD Index (pooled −1SD, Mean, +1SD and +2SD) are offered with their respective 95% CI in the right panel. Black dots represent PSI composite and CAARS ADHD index sample means for LNCG lower (left) and MTA (upper right). X axis values are raw CAARS ADHD index scores.

