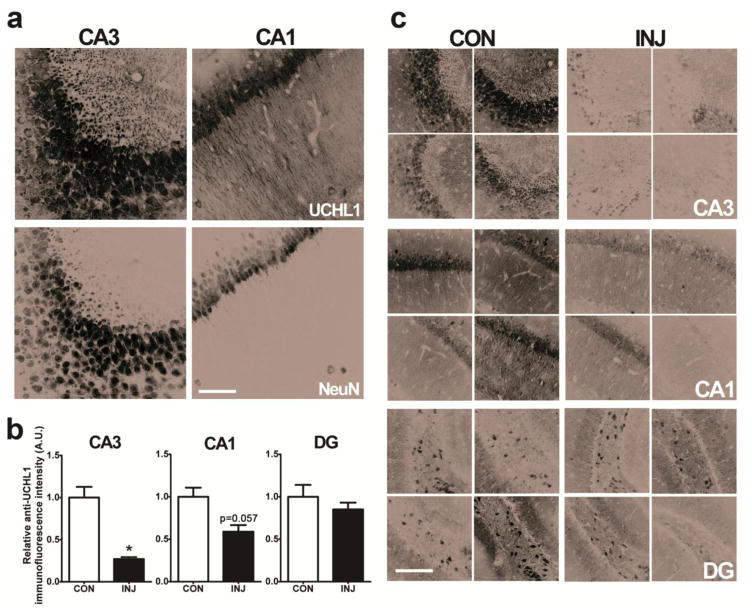
Fig. 4. UCHL1 is downregulated in the ipsilateral hippocampus at 24 h after SE.
(a) Confocal imaging showing UCHL1-immunoreactive cells in the mouse hippocampus. NeuN was used as a counterstain. Scale, 50 μm. (b) Relative anti-UCHL1 immunofluorescence intensity was calculated for sections depicted in (c) where analysis of UCHL1 staining was carried out using confocal microscopy, in control animals and in animals that underwent SE 24 h previously (n = 4, Mann-Whitney U test, two-tailed). Scale bar, 100 μm. Data expressed as mean ± SEM. *P < 0.05. CA, cornu ammonis; CON, control; DG, dentate gyrus; INJ, injury

