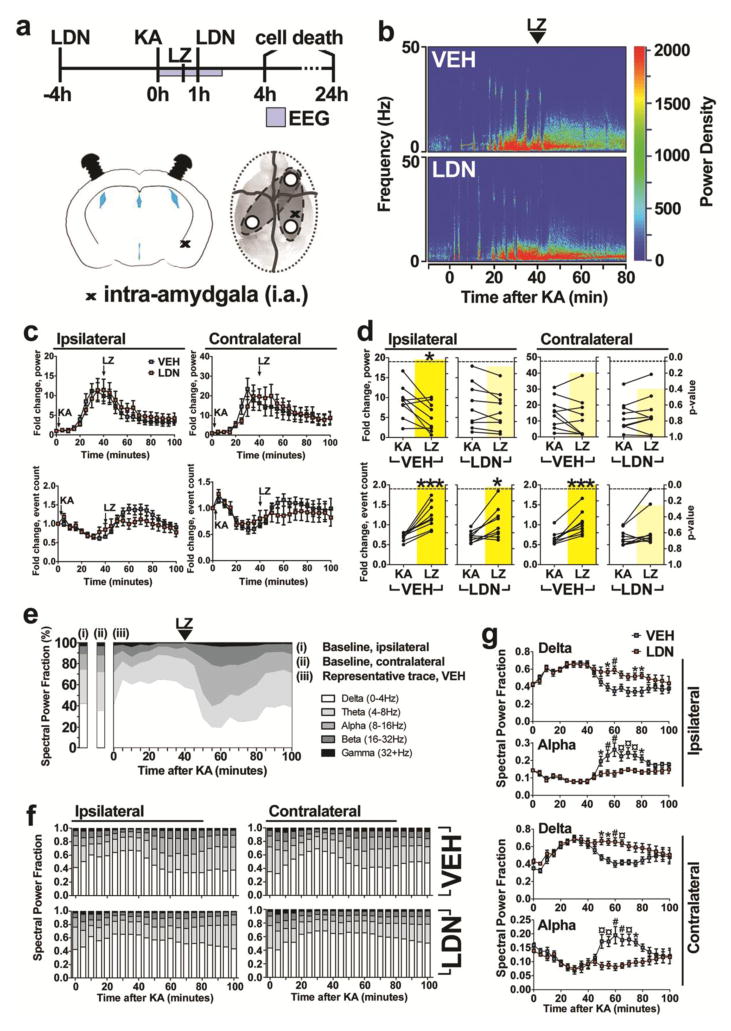
Fig. 6. UCHL1 inhibition prolongs seizures after status epilepticus.
(a) Experimental design for assessment of effects of UCHL1 inhibitor on SE. Mice received LDN-57444 and then 4 h later were injected (i.a.) with KA to trigger SE, followed after 40 min by lorazepam. EEG recordings were made for 2 h after SE, during which time a second injection of LDN-57444 was performed. Cell death was assessed at 4 h and 24 h after SE. (b) Representative power density analysis of EEG during SE as heatmaps for mice receiving vehicle or LDN-57444. (c) Power and spike frequency traces of 5 minute time-bins were generated from EEG data for LDN- and vehicle-treated mice (n = 8 to 10, two-way ANOVA with Bonferroni post-hoc test). (d) The ratio against baseline for both power and frequency was calculated for periods before and after lorazepam treatment, in both groups of mice (n = 8 to 10, paired Student’s t-test, two-tailed). P-value is overlaid in yellow. (e) Representative trace of EEG power fractionation into five frequency bands using Labchart, displaying EEG evolution before and after KA injection (i.a.). (f) EEG power was fractionated as in (e) for both LDN- and vehicle-treated mice (n = 8 to 10). (g) Two-way ANOVA comparisons (with Bonferroni post-hoc test) were performed for alpha and delta frequency patterns between LDN- and vehicle-treated mice. All data expressed as mean ± SEM. *P < 0.05; # or **P < 0.01; ¤ or ***P < 0.001. KA, kainic acid; LDN, LDN-57444; LZ, lorazepam; VEH, vehicle

