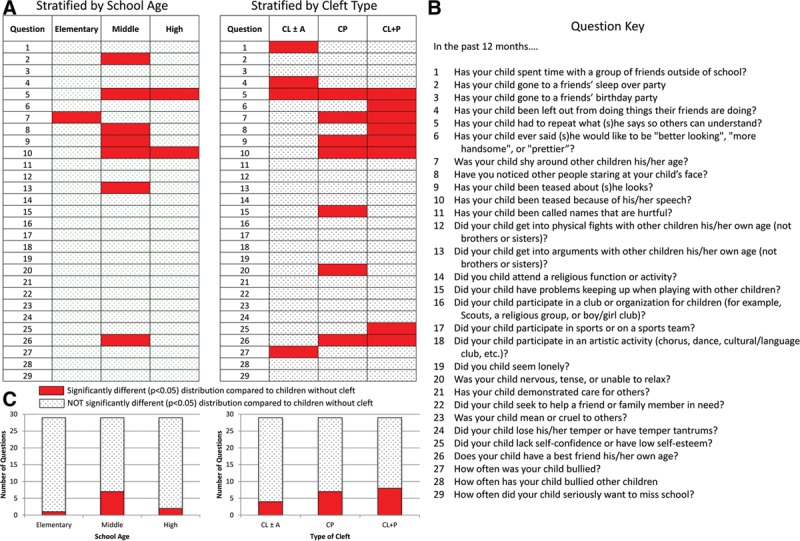
Fig. 2.

A question key of the 29 questions with social implications (B) and the results of comparisons between children with CL/P and unaffected children, stratified by school age35 and cleft type (A). The number of questions for which the responses of the experimental cohort significantly (P < 0.05) differed from the unaffected cohort is summated and graphically depicted (C).
