
Fig. 3.
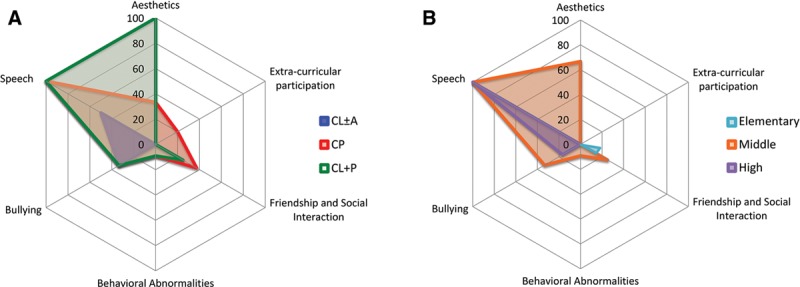
A radar chart illustrating the trends of CL/P’s social implications as determined by cleft type (A)35 and school age (B). The further the shaded area extends from the center (toward the periphery), the stronger the trend. The numerical values at each level represent the percentage of the questions within the subdivision that were found to significantly differ from the unaffected cohort.