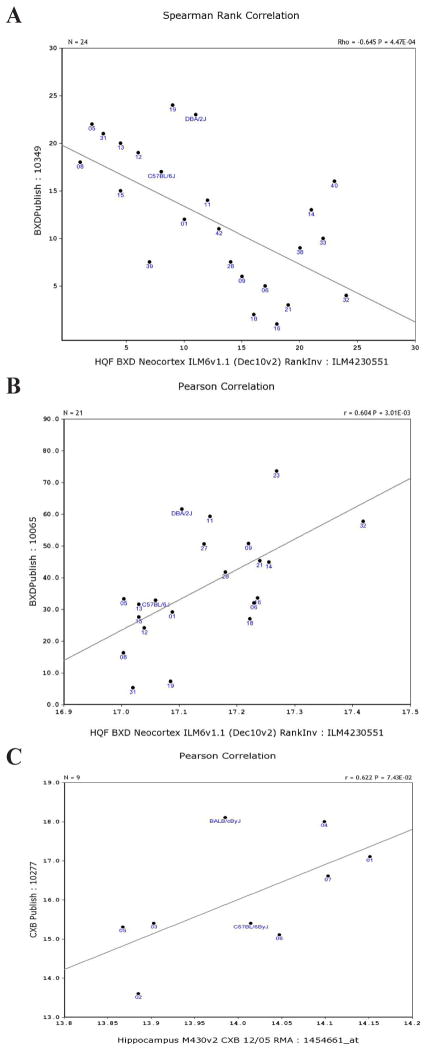
Figure 2.
Correlations between Atp5g3 expression levels in hippocampus and phenotypes. Spearman rank order correlations were obtained between the Atp5g3 expression levels and phenotypes in the GeneNetwork database. A. Response negatively correlated to ethanol (1.75 mg/kg ip), according to the time to ataxia. B. Positive correlation with long-term ethanol response measured by chronic withdrawal. C. Positively correlated to body weight.

