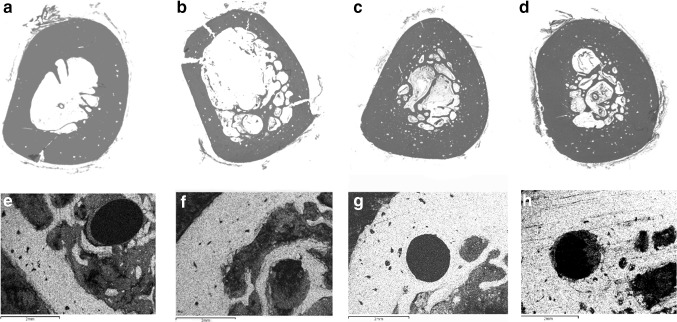
Fig. 3.
Osteointegration 1 month after intramedullary wires introduction: a, e group 1; b, f group 2; c, g group 3; d, h group 4. Upper row histotopographic sections. Hematoxylin and eosin staining. Mag. ×1.5. Lower row maps of X-ray electron probe microanalyzer by characteristic calcium radiation. Mag. ×20

