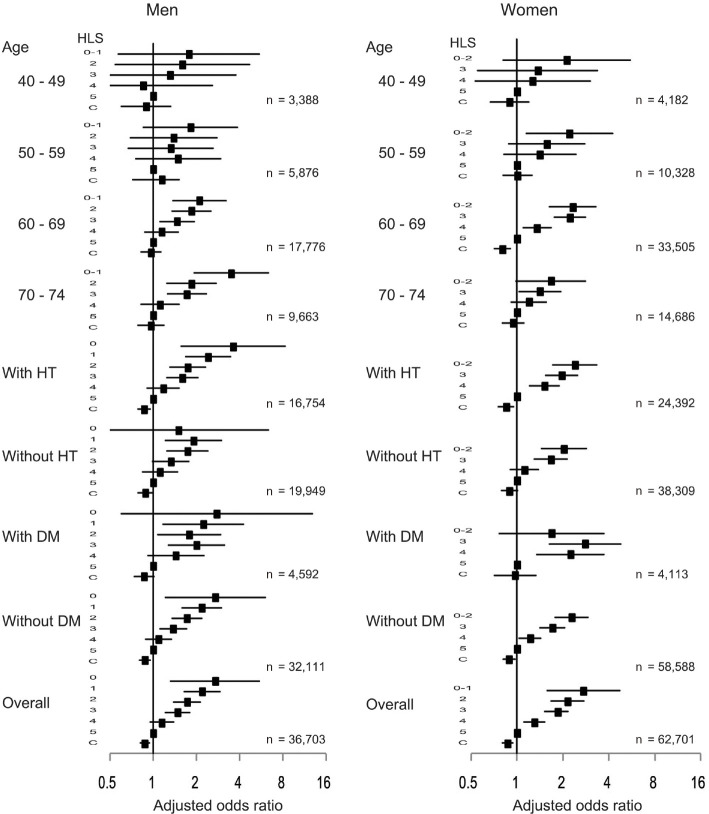
Figure 3.
Forest plot showing odds ratios with 95% confidence intervals for the association between baseline healthy lifestyle scores or changes in healthy lifestyle scores and the incidence of proteinuria in the subgroups and the entire study population. All analyses were adjusted for the following covariates (except for the variables used to define the subgroup in each case): age, hypertension, diabetes, and hypercholesterolemia. C: changes in healthy lifestyle scores, DM: diabetes mellitus, HT: hypertension, HLS: healthy lifestyle scores

