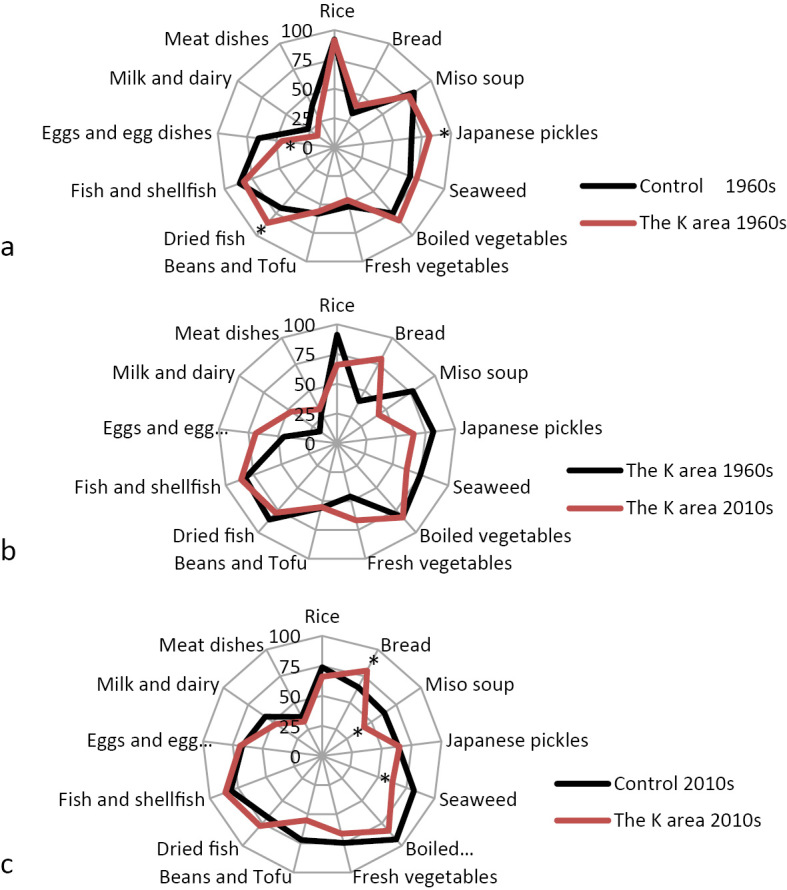
Figure 1.

Laser charts of the lifestyle changes in the K area between the 1960s and present. The percentages of K residents who answered that they frequently ate selected food items were compared with those of the controls in the 1960s (a). The percentages of K residents who answered that they frequently ate selected food items were compared between the 1960s and present (in the 2010s) (b). The percentages of K residents who answered that they frequently ate selected food items at present (in the 2010s) were compared with those of the controls at present (in the 2010s) (c). *: p<0.05
