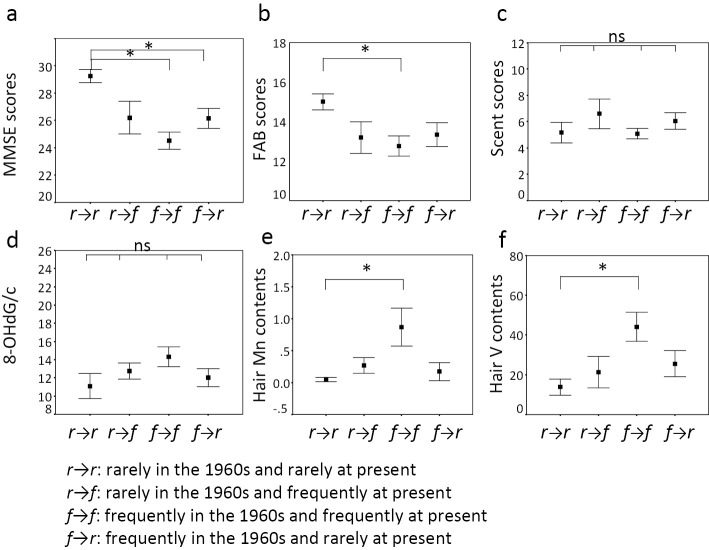
Figure 2.
The relationships between the changes in the consumption of Japanese pickles and cognitive function test scores, 8-OHdG/c levels and hair Mn and V contents. The labels of the x bars from Figs. 2 to 4 are as follows:r→r: rarely in the 1960s and rarely at present,r→f: rarely in the 1960s and frequently at present,f→f: frequently in the 1960s and frequently at present,f→r: frequently in the 1960s and rarely at present. The MMSE scores of ther→r group were significantly higher than those of thef→f and thef→r groups (a). The FAB score of ther→r group were higher than those of thef→f group (b). The scent scores were not significantly different among the four groups (c).The 8-OHdG/c levels (ng/mg of creatinine) were not significantly different among the four groups (d). The hair Mn contents (μg/g wet weight) of ther→r group were lower than those of thef→f group (e). The hair V contents (ng/g wet weight) of ther→r group were significantly lower than those of thef→f groups (f). *: p<0.05, ns: not significant.The plot and bar show the mean value and standard error, respectively.

