Figure 3.
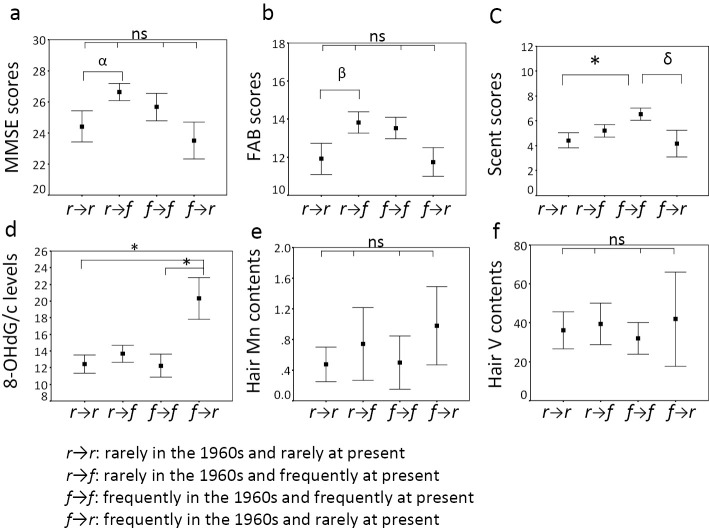
The relationships between the changes in the consumption of fresh vegetables and cognitive function test scores, 8-OHdG/c levels and hair Mn and V contents. The MMSE scores were not significantly different among the four groups. However, on compareing ther→r group and ther→f group, the MMSE scores of ther→r group were lower than those of ther→f group (a). The FAB scores of ther→r group tended to be lower than those of ther→f group, on comparison between ther→r group and ther→f group (b). The scent scores of ther→r group were lower than those of thef→f group, and the scent scores of thef→f group tended to be higher than those of thef→r group (c). The 8-OHdG/c levels of thef→f group were significantly lower than those of thef→r group. The 8-OHdG/c levels of thef→r group were significantly higher than those of ther→r group (d). The hair Mn and V contents were not significantly different among the four groups (e and f). *: p<0.05, α: p=0.045, β: p=0.056, δ: p=0.058, ns: not significant. The plot and bar show the mean value and standard error, respectively.

